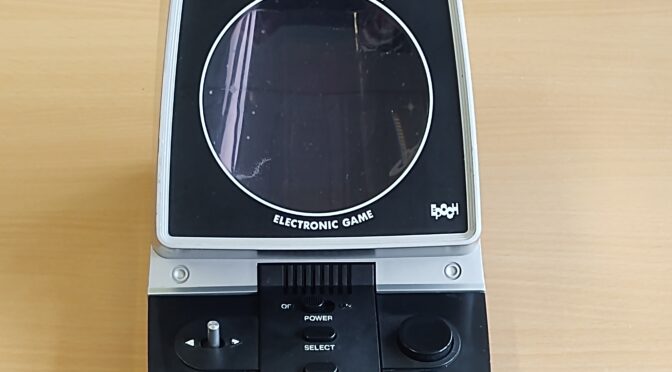
All posts by ingmarsretro

Data Node with Arduino

Loading

Unfortunately, the intervals in which I find some time to write a new post for the blog have not gotten shorter. But post a post per month, I think … 🙂

This time it’s not a retro craft project from the local Gefielden or a restoration of an old device, but again something about Arduino. The idea – to build a sensor that, as always, transforms a physical quantity into an electrical signal. This is nothing special and what kind of sensor it will be, I will not describe for the time being. But there should not be a sensor board, but many. And these sensor boards short “sensors” are to be networked together in a two-dimensional matrix. You can imagine it as a chessboard, with each of the chessboard panels representing a sensor. This network of sensors – ie sensor nodes – should then be connected via a transfer point to a computer and output the sensor data of the respective field. It should then also be possible to remove individual fields from the network without the remaining network losing its function.

The whole system should be as simple and cheap as possible. And so a system concept was quickly developed in which the nodes communicate via the I²C bus and send their data to a master. The following diagram is intended to illustrate this.

This concept, I thought, is easiest to implement with an ATmega microcontroller. The has enough IO’s, an I²C bus and UART onboard, as well as analog inputs and requires little component peripherals to bring it to life in its own layout. And there is nothing faster to do such a test setup of such a node network than to use the well-known Arduino development boards. I have chosen the cheapest version for a test setup -> the Chinanachbau of the ArduinoUno (Joy-IT UNO) with the Atmga328 in the capped DIL housing.

Joy-It Uno Boards

The picture shows ten of these microcontroller boards. Of these, one should be used as a bus master and nine as slaves. Of course, each of these slaves has a unique bus address, which only occurs once in the system. In the test setup, this bus address is permanently assigned via the program code, since anyway each Arduino must be connected to the computer in order to carry out the program upload. Of course, that should look different later. Because the Arduino is on the Atmega328 chip, its quartz and the few resistors reduced on the sensor board with gelayoutet. The chip should then be programmed via the ISP pins. Of course, as many boards do not always customize the program code and they all have the same Flash file, I want to set the sensor address with a 7-bit DIP switch. A 4021 Cmos Static Shift Register is supposed to read the bits after the controller is powered on and push them serially into the controller. The resulting value is then available as a bus address in a variable.

Each of these slaves with their individual bus address is now queried in sequence by the master node, which state it has and whether it should switch an output or not. That is, the node has only one DO (digital output) with which it can, for example, turn an LED off and on and interrogate one or more DIs (digital input) which polls a state, for example a simple switch. These functions are stored in 2 bits of a byte. Another byte is used to transfer the bus address. So two bytes are sent over the bus. The picture below shows the test setup with the “UNO boards”

All Arduinos are connected to I²C data bus and power supply

The process is as follows:

MASTER:
The master node sends a request after the series to all slave addresses and a switch command (which comes from all nodes of a TEST push button input on the master) for the LED output of the node and sees if a response comes back or not. If no answer comes, the node is not in the network or is defective. If there is an answer, this consists of the address of the node and its status byte. This information is transmitted via an RS232 terminal to the computer connected to the master. Thus, for example, the switching status of each individual node can be displayed on the screen via a visualization using (NI LabView, or Matlab or similar). By adapting the master program, it is also possible to switch the LED outputs of the slaves via the computer.

SLAVE:
When the master node requests data from the slave, the slave sends back two bytes. Where byte0 again is the slave ID (ie bus address) and byte1 is the data. Byte1 actually consists of only two bits encoded as follows (in decimal representation):
 0 = LED off| Sensor not triggered
 1 = LED on | Sensor not triggered
 2 = LED off | Sensor triggered
 3 = LED on | Sensor triggered

The program code as an example:

 1
 2
 3
 4
 5
 6
 7
 8
 9
10
11
12
13
14
15
16
17
18
19
20
21
22
23
24
25
26
27
28
29
30
31
32
33
34
35
36
37
38
39
40
41
42
43
44
45
46
47
48
49
50
51
52
53
54
55
56
57
58
59
60
61
62
63
64
65
66
67
68
69
70
71
72
73
74
75
76
77
78
// I2C Slave Code
// 16.05.2018 
// ver 1.3
#include <Wire.h>
#define ADDRESS 2     // adresse des slave knotens
#define PAYLOAD_SIZE 2 // anzahl der bytes  die vom masterknoten zu erwarten sind
int LED=12;            // indicator led an pin D12
int SENSOR = 8;        // sensor input an pin D8
bool actionState=0;      // sensor zustand
int busstatus;  // statusvariable 
                       // 0 = LED aus | sensor nicht belegt
                       // 1 = LED ein | sensor nicht belegt
                       // 2 = LED aus | sensor belegt
                       // 3 = LED ein | sensor belegt
 
bool sensled=0;          // sensor LED
byte nodePayload[PAYLOAD_SIZE];

void setup()
{
  pinMode(LED, OUTPUT);         //sensorLED
  pinMode(SENSOR, INPUT);       //Sensor 
  Wire.begin(ADDRESS);          // Activate I2C network
  Wire.onReceive(receiveEvent);
  Wire.onRequest(requestEvent); // auf master anforderung warten
                      //  // debug interface
                      //  Serial.begin(9600); 
}

// *********************************mainloop****************************************************
void loop()
{ 
  delay(5);
  
   if(sensled){digitalWrite(LED, HIGH);}
         else{digitalWrite(LED, LOW);}

  actionState = digitalRead(SENSOR);  //Sensoreingang abfragen        
   if((actionState==1)&&(sensled==1)) {busstatus=3;}
   else if ((actionState==0)&&(sensled==1)) {busstatus=1;}
   else if ((actionState==1)&&(sensled==0)) {busstatus=2;}
   else if ((actionState==0)&&(sensled==0)) {busstatus=0;}

                      //  Serial.println("######################");
                      //  Serial.print("busstatus neu setzen ");
                      //  Serial.println(busstatus);
                      //  Serial.print("sensled LED            ");
                      //  Serial.println(sensled);
                      //  Serial.print("actionState           ");
                      //  Serial.println(actionState);
                      //  Serial.println("######################");
  nodePayload[0] = ADDRESS;                  // Adresse in byte0 zurücksenden.  
  nodePayload[1] = busstatus;                //byte 1 ist die statusinfo der LED
}


// *********************************************************************************************
void requestEvent()
{ Wire.write(nodePayload,PAYLOAD_SIZE);  
  Serial.println("bytes status schreiben");
  Serial.println(nodePayload[0]);
  Serial.println(nodePayload[1]);
  delay(5);
}

// *********************************************************************************************
void receiveEvent(int bytes)  //einen wert vom I2C lesen
      
{
  
  busstatus = Wire.read(); //If the value received was true turn the led on, otherwise turn it off  
                              //  Serial.println("status empfangen");
                              //  Serial.println(busstatus);
  if((busstatus==1)||(busstatus==3)){sensled = 1;}
                                else{sensled = 0;}
                                              
}


The bus address must still be entered individually in this slave code. In the next version, the previously described “serializer” of the parallel dip-switch variant will be implemented. The following code example is from the master node, which reads out the slaves and sends a LED pattern to the sensor slaves using the test button:


  1
  2
  3
  4
  5
  6
  7
  8
  9
 10
 11
 12
 13
 14
 15
 16
 17
 18
 19
 20
 21
 22
 23
 24
 25
 26
 27
 28
 29
 30
 31
 32
 33
 34
 35
 36
 37
 38
 39
 40
 41
 42
 43
 44
 45
 46
 47
 48
 49
 50
 51
 52
 53
 54
 55
 56
 57
 58
 59
 60
 61
 62
 63
 64
 65
 66
 67
 68
 69
 70
 71
 72
 73
 74
 75
 76
 77
 78
 79
 80
 81
 82
 83
 84
 85
 86
 87
 88
 89
 90
 91
 92
 93
 94
 95
 96
 97
 98
 99
100
101
102
103
104
105
106
107
108
109
110
111
112
113
114
115
116
117
118
119
// I2C masterknoten 
// 16.05.2018 
// ver 1.2
// changes abfrage wenn kein knoten am bus dann 255 ausgeben
#include <Wire.h>

#define busbytes 2          // wievele byte vom I2C knoten zu erwarten sind
#define maxKNOTEN  10       // anzahl der zu scannenden slaves
#define startKNOTEN 2       // startadresse der slaves
#define DELAY 5             // einfach ein delay ....

int i; int j=0;
int buttonPin = 12;
int testbut = 0; int anim = 0;
int buttonState = 0;
int DATEN[busbytes];
int adresse; int busstatus;  
byte sensorbelegt; byte ledsensoron;

                       // 0 = LED aus | Sensor nicht belegt
                       // 1 = LED ein | Sensor nicht belegt
                       // 2 = LED aus | Sensor belegt
                       // 3 = LED ein | Sensor belegt

int leddat1[] = {1,1,1,1,0,1,1,1,1}; // -
int leddat2[] = {0,0,0,0,1,0,0,0,0}; // |

void setup()
{
  Serial.begin(9600);  
  Serial.println("MASTER-KNOTEN");
  Serial.print("Maximum Slaveknoten: ");
  Serial.println(maxKNOTEN);
  Serial.print("Datengroesse in byte: ");
  Serial.println(busbytes);
  Serial.println("***********************");
  
  Wire.begin();                 // Activate I2C link
  pinMode(buttonPin, INPUT);    // test-tastereingang festlegen
}


//#####################################################################################################
void loop()
    
{
  for (int Knotenadresse = startKNOTEN;         //alle knoten scannen
           Knotenadresse <= maxKNOTEN; 
           Knotenadresse++) 

        
    //################################################################################################       
    { 
     // testbut = 0;  
     anim = 0;   
    Wire.requestFrom(Knotenadresse, busbytes);        // daten vom jeweiligen knoten anfordern
                                                 
           DATEN[0]=255; DATEN[1]=255;   // wenn kein knoten dann auf 255 setzen    
          if(Wire.available() == busbytes) {                                    // wenn knoten und daten dann
            for (i = 0; i < busbytes; i++) DATEN[i] = Wire.read();          // daten holen (zuerst busID, dann daten)
           // for (j = 0; j < busbytes; j++) Serial.println(DATEN[j]);        // daten an rs232 ausgeben   
          }            

//            Serial.println(Knotenadresse);
//            Serial.println(DATEN[0]);
//            Serial.println(DATEN[1]);
//            Serial.println(" ");
           
            adresse=DATEN[0]; 
            busstatus=DATEN[1];
           
            if(busstatus == 0)       {sensorbelegt=false;  ledsensoron=false;}
            else if (busstatus == 1) {sensorbelegt=false;  ledsensoron=true;}
            else if (busstatus == 2) {sensorbelegt=true;  ledsensoron=false;}
            else if (busstatus == 3) {sensorbelegt=true;  ledsensoron=true;}
      
         //################################################################################################
         //Testbutton Status lesen und variable testbut entsprechend setzen
       
          buttonState = digitalRead(buttonPin);               //tastereingang einlesen
          if(buttonState == HIGH){                            //wenn taster aktiv dann variable anim setzen
          anim = 1;
          //delay(5); 
          }
            
//            //debug debuginfo tasterstatus auf rs232 ausgeben
//            Serial.println("#######################");
//            Serial.print("Knoten Adresse    :");
//            Serial.println(adresse);
//            Serial.print("Busstatus         :");
//            Serial.println(busstatus);
//            
//            Serial.println("----------------");
//            Serial.print("Fliese belegt    :");
//            Serial.println(sensorbelegt);
//            Serial.print("LED Fliese       :");
//            Serial.println(ledsensoron);
//            Serial.print("#######################");
//            Serial.println(" ");
      
          //################################################################################################
          //Testbutton Status an jeweiligen knoten senden
      
          Wire.beginTransmission(Knotenadresse);           // transmit to device actual in for loop
          //anim schreiben
                    
           if (anim==0) {testbut=leddat1[j]; j++;}
                   else {testbut=leddat2[j]; j++;}
           if (j>8){j=0;}
          
          Wire.write(testbut);                             // senden des tasterstatus
          Wire.endTransmission();                          // ende gelände mit uerbertragung
       
          delay(DELAY);
          

    }
   
}


With this arrangement, it is now possible to read all Arduinos and their input or to control the LED via the bus. In the next step, a “sensor” is built, a board is laid out and the ArduinoUno reduced to its microcontroller. I’ll talk about that in one of the next posts …


Solar – Radiometer

Loading

The Radiometer – also called lightmill – is an instructive, physical demonstration object that was invented about 100 years ago by the English physicist Crookes. This small physical-technical arrangement clearly shows how light is converted into mechanical energy.


The working princip of the solar radiometer:

Impeller inside the part evacuated glass ball

If warm light, ie sunlight, light of light bulbs or spotlights, meets with light in the spectrum of which the infrared component is present (but not cold light from fluorescent lamps) on the wing cross resting on a needle, this will turn depending on the intensity of the light source , In a particular method, a partial vacuum is generated in the glass ball, so that the air resistance is not stronger than the rotational force of the impeller generated by the light energy. The blackened surfaces of the wing cross absorb more light energy than the bright surfaces. Due to the warming of the air molecules, a much higher pressure is created on the dark areas than on the bright areas. This causes the constant rotation of the wing cross. (Brownian Molecular Theory). Depending on the light intensity, up to 3000 revolutions per minute should be achieved. (Source: Manufacturer of the Radiometer)


Temperature sensor for IV-11 DCF melody

Loading

A functional update for the IV-11 DCF melody watch is available from gr-projects. It is a radio temperature transmitter. The special thing about it is, that the transmitter operating in the ISM band 433 MHz is equipped with a photovoltaic cell (solar cell). Depending on the version, a small rechargeable battery or a CR2032 button cell can be installed in the transmitter. The battery is thus supported by the solar cell in the sunlight or in the battery version it is charged during the day and then keeps the transmitter in operation over the dark time.

The assembly is easy. The kit consists of a transmitter and a receiver. The boards of transmitter and receiver are equipped with few components quickly. Here, however, some attention is required and you should read the documentation carefully, because due to the lower number of kits, the boards are manufactured without component imprint and solderstop.

transmitter module

The radio modules themselves are completely pre-assembled (SMD) and only need to be soldered into the corresponding circuit boards. Optionally, a trim potentiometer can be connected in parallel to the temperature sensor (NTC) for adjustment purposes. The transmitter, like the receiver, is installed in a small PVC housing. Here, except for a 3mm drill hole and possibly some silicone for the sealing of the solar cell (for operation outside the window sill) no further tools are needed.

transmitter complete with PV-cell

To connect the receiver to the clock, make a few minor changes to the clock’s mainboard. First, the microcontroller is replaced – logically – because there is indeed a new program that then displays the temperature in the date line. A resistor is removed, one is added and a jumper can be swapped. The connection between the clock’s motherboard and the radio receiver is made with a piece of cable. Three lines are required (GND, + 5V and the data signal from the receiver controller to the clock controller). That’s it then already. The clock can go into operation. After a few seconds, the received temperature is displayed in the tube.

receiver in it´s case


A video how to solder the circuit is available here:

USB stick defective?

Loading


Again and again it happens to me that a USB memory stick loses its function and is suddenly no longer recognized. Often the stick is still registered as a drive in the system, but it lacks the disk, or even the system reports that the stick is not formatted. And even though he just recently, full of important data, has worked in another computer. 🙂 (Here would now be the story with the backups or backup copies …). All these problems are mostly due to operator errors or mechanical problems. For example, an operator error may be that the stick is being pulled while one more writing is in progress. The stick is then de-energized during a process. And depending on whether the controller or flash memory can handle it, the stick will survive or not. Often, mechanical defects are the cause of breakdowns. So it may be that the solder joints between the connector and the board break, or get the connecting pins of the quartz or oscillators contact problems.

In this case, I got a miniature stick from extrememory, which does not want to give away its stored data. It is displayed in the system administration, but if you want to access it, the message “no data carrier found” comes. The attempt to format or partition over diskpart from the commandline did not work. Also various tools like “SDFormatter” or “USBstick_Formattool” failed. Even with Linux or on MAC systems, no success was achieved. So a stick for the barrel … But I thought, even if the stick in its small design rather not close to a mechanical defect – why not take a look anyway 🙂 And at 16GB I will not give up so fast.

So I tried to gently open the case by first removing the metal case of the USB connector.

That works quite well. After I wanted to take a closer look at the appearing small printed circuit board with its tracks, there suddenly appeared something familiar.

That looks like an SD card. More specifically, like a microSD card.

That’s the way it was. The USB stick is nothing more than a MicroSD card reader, in which such a card is installed. Using tweezers, the SD card could be levered out.

Apparently here again the problem is with the contacts, or contact springs between card and card reader. It is the cause of the problem, because the SD card worked fine in another card reader and all the data was available. It pays to invest in front of the garbage bin for a few minutes and to inspect the innards of the device.

DAT-Walkman Sony TCD-D3

Loading

Sony TCD-D3

At least one blog post per month to write I have set myself the goal, even if it is not always easy to implement this temporally. Anyone who has small children himself can perhaps imagine that. But in the evening and in between, I can collect material and edit it. -> it just takes everything much longer. This time I organized a Sony DAT recorder for retro audio. It is a Sony TCD-D3 from 1990-91, a so-called DAT Walkman.

DAT (Digital Audio Tape) is an audio magnetic tape recorded digitally. The recording format and the sound quality are essentially similar to those of the audio CD. The recording takes place on small cassettes, which were also used in the storage area in the EDP (DDS tapes). The DAT format was intended as the successor of the audio cassette, could not prevail in the broad market. It is also discussed here that the music industry did not want to see the format in the consumer world, as it was possible with the system to produce digital, lossless copies.

The technical structure of the cassette drive corresponds to that of a video recorder. The tape is pulled out of the cassette with loading arms and passed around a rotating head (DAT-R). The recording is done in helical scan. The copy, which I acquired this time as “defective”, was with the defect: Cassette shaft does not open, described. After dismantling, I noticed that I was not the first to look at the inside of the device after the factory. Someone was already messing around. All (tantalum) capacitors were soldered, the lead wires to the battery pole contacts were “pinched off” and the wires were missing. The Flexiprint, which connects the front panel to the mainboard, had a broken track when looked at closely.

fixed trace

The broken wire could be repaired by carefully scraping off the insulation and brazing a stranded wire. The capacitors I have all newly soldered and of course checked before. Here I noticed that some were not soldered properly and had a cold loosening at a pole or were not connected to the pad. The battery contacts were also provided with new wires. On the mainboard there is also a DC / DC converter, which makes the supply voltages for the logic and the audio components from the 9V input voltage. (5V +/- 7V). This converter is housed in a completely soldered tinplate box. Of course, nobody was inside and checked the Elkos inside. That was done quite quickly and the small box was overtaken. Now I was able to provisionally reassemble the boards and drive and put them into operation. As data carrier I used a DDS (storage) cassette. So tension on it and “Eject” pressed and lo and behold, the cassette compartment opens immediately. From my Handyaudioplayer as a music source, I made a trial recording. And what can I say, a wonderful sound quality!

The next issue to fix is ​​more of a visual nature. These are the side casings, which are coated with a rubber coating and this begins to seem to change chemically and becomes sticky. So I washed this gum carefully with isopropanol and tried not to replace the white printed lettering with. That worked quite well. With acrylic clearcoat I then painted the parts.

painted side casings

After curing the clearcoat I was able to assemble everything again and start the final test. The following pictures show the inside of the TCD-D3.

Specifications of the TCD-D3

  • Type: Digital Audio Tape Dec
  • Audiotracks : 2-channel stereo
  • Tape speed: 4.075, 8.15 mm/s
  • recording time: 240 minutes
  • headsystem: 2000rpm, rotary
  • D/A converter: 16 bit linear
  • A/D converter: 16 bit linear
  • Samplefrequency: 32-48kHz
  • Frequency Response: 20Hz to 22kHz
  • Signal to Noise Ratio: 90dB
  • Dynamic Range: 90dB
  • Total Harmonic Distortion: 0.0008%
  • Analoginput: 80mV (line), 0.25mV (mic)
  • Analogoutput: 0.5V (line)
  • Dimensions: 85.2 x 40 x 120.1mm
  • Weight: 0.42kg


Sony RX100 digital camera (and its repair)

Loading

The Sony RX100 digital still camera with its 20.2 megapixel EXMOR CMOS sensor impresses with its excellent image quality and compact design. The sensor size of one inch and the front Zeiss Vario Sonnar F1.8 lens are also responsible for the good image results. With 10x6cm and a thickness of 3.6cm, the camera is still suitable for pockets. (Although I would not recommend it). The 3.6x optical zoom lens is retracted when it is switched off and extended when in use.

But after some time and a number of in´s and outs of the optics, it may – or better – it will come to a situation where the optics refuse to serve. This manifests itself in different ways. Either nothing happens after switching on, the optics do not move and only the message (“Power Off and on again”) appears on the display, or the lens moves out a bit and then back in again. Now you could assume that the camera has mechanical damage, the sliding surfaces inside the optics are dirty, or something is bent or warped and jammed by a possible fall. But that’s usually not the case. In this case, the camera has never been subjected to strong mechanical, thermal, etc. stresses and there is still an error. If you do a little research on the Internet, you will find some repair tutorials where you try to clean with some paper strips between the slide rings of the optics etc. No reasonable information was found. So I have no choice but to look for the cause of the problem myself. And it was found quickly. After opening the device and slightly lifting the rear housing cover, the object suddenly extended again. If the lid was replaced, the problem was there again. So there had to be a contact error somewhere. In the following lines I present my way to a functioning camera:

After loosening the screws and removing the plastic base plate, the rear cover can be removed with the control panel and the monitor.

The Flexprint for the screen and the one for the control unit can be released, the small speaker can simply be hung up. Now the battery can be inserted and the camera can be switched on again. In this case the lens opened and extended again correctly. So it’s really a contact problem. But where? I tried to put light pressure on the Flexiprint, which supplies the mechanical part of the optics. (Not the one that leads from the sensor to the mainboard.) With this slight pressure on the Flexprint, the device was switched on again and lo and behold -> hit. The optics didn’t move. That could also be understood. So this Flexprint seems to have a line break at the kinks. Apparently, this print is mechanically stressed due to the construction and retraction of the lens and thus yields and breaks at some point. (Perhaps also planned obsolescence). Anyway, I looked for a replacement on the net, found it and after a week of waiting the new Flexiprint was already delivered.

The new print for the optics is sold without any components. This means that from here a little experience in handling soldering tools, SMD components and flexible circuit boards is required.

The optics must be exposed and removed. To do this, the mainboard must be detached. (three screws in total). Then carefully remove the black film from the back of the optics. (Be careful with all flexible cables) Once the film is off, the flexprint to the sensor can be unplugged.

Next, the motor unit is released and the motor is separated from the lens housing.

There are some components on the print, such as plug connections and small fork light barriers, which are installed in the lens (lens position) and in the motor unit (two pieces as incremental encoders and for determining the direction of rotation). These are held in place with small metal brackets and must be released before removing the lens unit.

The lens, drive unit and mainboard are removed. All plug connections between the optics and the drive motor must be disconnected.

The motor unit can now be separated from the lens. The Flexiprint is attached to the lens housing with tape and small hooks. These have to be solved.

Now disassembly of the motor unit continues. As previously mentioned, there are two fork light barriers in the plastic housing of the motor gearbox, which are also held in place with a clamp. This can simply be clipped out. To complete the removal, the motor must be unsoldered. Now the Flexiprint is free and the delicate step can begin.

The small SMD connectors must be unsoldered from the old print and reattached to the new print. This work requires cleanest hand towels, as the small plastic housings can be easily destroyed when unsoldering. I recommend here to heat the print only from the bottom, and then lift the plug off with tweezers. Otherwise you run the risk of deforming the plastic of the connector too much heat. If this is successful, the plugs can be soldered onto the new Flexprint.

The same work is also to be done with the fork light barriers. Then only the contacts of the motor have to be soldered to the designated positions in the flex board.

If that worked, the assembly can be done in reverse order. When bending the flex board into the correct position, you can orient yourself on the old board. Then the installation should not be a problem. A function test should be carried out before attaching the rear wall of the camera (rear cover). The lens must extend and retract without a monitor or control panel. If that also works, then it can be finalized. In my case, the repair was successful. Let’s see how long it takes for another conductor to break in the flexible PCB …

Panasonic AG-6400 VHS-Portable

Loading

Panasonic AG6400

A new member of the collection of old multimedia devices is the Panasonic AG-6400. The AG-6400 is a (semi) professional video recorder from the 80s. The device records on VHS magnetic tapes and also reproduces this standard. It is portable and was the recorder for the video cameras of that time. It draws its energy from 12V NP1 batteries and can provide approx. 27W for the camera connected to it. That was about the power requirement of a 3-tube camera.

This device, too, had gotten some traces of time that largely restricted its function. Simply said – it was broken. This defect manifested itself in a stuck capstan shaft . At first I thought the shaft was ‘seized’ due to corrosion, but the reason was completely different. Interestingly, a ball bearing had been pressed out of its press fit, so that the flywheel attached to the shaft touched the bobbin of the capstan motor. The magnets in the flywheel held it in place. This error could be easily and quickly remedied by pushing back the ball bearing and then fixing it.

the videorecorder without housuing
pcb folded out to service position
view to the mechanics (drumhead)

After the mechanical fault was repaired and a first function test, a fault in the 5V power supply was still to be found on the power board. This was expressed by a failure to start all drives. Here, an IC fuse was defective in the switching converter. This was triggered by a defective Schottky diode in the buck converter circuit. This bug was also quickly solved. And after checking and adjusting the operating voltages according to the setpoints in the service manual, the drive did its job again. I was even amazed at the excellent image quality that the device could reproduce. Due to its compact dimensions, I can even use the AG6400 to digitize old VHS tapes in the future.

Elaborate wiring between the boards


frontview

In the data sheets and advertising for the AG-6400, the manufacturer has advertised some features and functions as follows:

High quality image reproduction

The tape speed corresponds to the VHS standard with a video track width of 49µm. Several technologies for clear and detailed image reproduction are combined in the device.

HI-FI Sound
A four-channel system consisting of two ‘normal’ audio channels with Dolby noise reduction and two ‘HD-Sound’ channels allow you to enjoy high quality recordings. A 3.5mm headphone jack and two 6.3mm microphone jacks for separate feeding of both channels, including separate control with VU meters, complete the range of audio options.

VU-meter and audio level controls

Time Code record and playback
For control in linear editing systems, the recorder enables the recording of external EBU timecode signals on channel 2 of the longitudinal track.

External camersocket

A connection for an external camera with a maximum power consumption of up to 27W is also available. Cameras with 3-tube Vidicon system can be connected here.

A diagram with the connection options is shown in the following picture:

Anschlußschema de AG6400 (Bild: Herstellermanual)

Technische Daten:

Manufacturer National/Panasonic  Central Osaka Japan
Year ca. 1988
System VHS Portable Videorecorder
Powersupply DC 10.5 to 16V
Powerconsumtion 14Watt, (with camera ca. 41W)
Videosystem Fourhead  rotationsystem (helical scanning)
Luminanz FM azimuth recording
Farbsignal subcarrier phaseshift Recording
Video SNR 43dB
Audiosystem Normal und HD-Audio
Normalaudio 1  fixed audiohead
HD-Audio 2  rotating heads , 1 earasehead
Stereoton Normalstereo (2Kanäle über Längsspur )
  HD-Stereo (2Kanäle über Schrägspur)
TV-System CCIR (625 Zeilen, 50Halbbilder) PAL Colour
tape speed 23.39mm/s
rewind time(180min tape) 4.5min
size 222x90x270mm
weight 3.0kg (without battery)

Sony Video8 Walkman GV-8E

Loading

Sony GV-8E

Occasionally I browse flea market websites for vintage and retro devices from the 70s, 80s and 90s. If an absolute bargain is in sight, then I strike and sacrifice a few euros. This time I found a whole box of Sony portable media players. The whole thing just cost me the equivalent of a pack of Cafe. However, the state of the devices in terms of function is also unknown. A particularly beautiful piece (yes – that’s always in the eye of the beholder) from this box is the Videowalkman GV-8E from Sony. This is a portable, analog video player / recorder that has a VHF / UHF television tuner and an LCD monitor integrated in one device. While that may not be anything exciting today, the GV8E was a very nice and expensive piece of technology when it was launched in 1988. So the portable lands on my table and gets its 6V DC supply from the power supply. The disillusionment comes as quickly as the initial euphoria. The device shows no function despite the power supply being upright. It does not react to any key press, no LED lights up. (Somehow I was expecting this or something similar)

But the ambition is too great not to look inside the device and to look for the problem. I quickly started disassembling and roughly dividing the device into its components. The service documents can be found online, which are very helpful here.

GV8E in parts

After examining the block diagram of the entire system, the start of the troubleshooting was the DC / DC converter board. This board, covered by a shield plate, produces all the voltages required for the supply of the individual components from the 6V input voltage. A measurement on the test pins on the board showed that some voltages were missing. So there must be a problem here.

solder side of the DC/DC converter board
partside of the DC/DC converter boards

After removing the shield plate and inspecting the components, I noticed a defective 1.6A fuse (F103). This fuse protects the primary circuit of the switching converter. It can be seen from the plan that transistor Q114 was low-resistance and thus caused the fuse to trip.

extract from the circuit diagram of the DC / DC converter

The transistor is a 2SB1121 bipolar PNP transistor. Of course I didn’t have that in my collection. So thinned the component boxes for a suitable replacement …

replacement for the 2SB1121 is the PBSS5250Z

Then I found a PBSS5250Z, which has a slightly larger housing, but should do its job in the circuit.

defective Q114 desodered

Due to the larger design and the limited space available, I could only solder the replacement transistor upright.

Q114 renewed

Now a new fuse is still missing in the board. After installing and checking the other components in the affected circuits, the next function test was started. All boards electrically connected again and 6V connected to the battery terminals – and look – the Powersupply board starts up and the voltages are there. Now the GV8E can be switched on again with the power button, the LED also lights up and a quiet noise can be heard from the loudspeaker. However, none of the drive motors are running and the LCD monitor remains dark. The LED lights up briefly when the “Ejekt” button is pressed, but the motor responsible for ejecting the cassette compartment does not start. That means -> continue searching for errors. First of all I will take a look at the LCD monitor. It is quickly removed and dismantled. All the less pleasing is the condition of the board. Here the “decaying” electrolytic capacitors raged with their “body fluids”. (Of course this means the electrolytes)

Leaked electrolytic capacitors

The liquid electrolytes of the electrolytic capacitors have leaked over the years and have attacked the conductor tracks and also the solder joints. Sometimes it is so bad that small components, such as SMD transistors and resistors, fall off the board as soon as they are touched. At the latest now it is absolutely necessary to have the circuit diagram of the device at hand. Otherwise it will be difficult afterwards to correctly refill the missing parts. But first the old electrolytic capacitors had to be removed.

this is what the circuit board under the electrolytic capacitors looks like

With PCB cleaner I was able to remove the remains of the electrolytes and only then could I see the damage to the circuit board. Corroded areas had to be sanded with a glass brush and burned components had to be replaced. After cleaning again, the new capacitors (this time ceramic multilayer capacitors instead of the electrolytic capacitors) have found their place.

pcb with new parts

After this procedure the time had come. The next function test started. After reconnecting all plug connections and the power supply, there were further signs of life. The backlight (CCFL) started again and in the upper left corner it was “00:00” to see the flashing clock of the on-screen display … Unfortunately, that was all. The OSD display was very blurry and the rest of the picture was white. The brightness controls did not respond. So the board had to be examined “big”.

The board of the LCD monitor still had many broken conductor tracks, which had to be laboriously repaired with individual strands and enamelled copper wire. There were also some SMD components (resistors and transistors) so corroded at their connections that only an exchange helped. The result looks a bit wild, but another function test was finally positive.

fixed displayboard

After I reassembled the monitor, I went to the drive. Here, too, I first checked or renewed all SMD electrolytic capacitors, as ALL of them had really leaked out. Fortunately, the circuit boards here were not so severely etched and can be easily cleaned. Then the function test came. And unfortunately there were still problems here. There was no cassette ejection and no reaction from any of the drives. After studying the service manual and measuring many supply voltages, I was able to identify a processor as a source of errors. It is a SONY CXP80116.

Sony CXP80116

This chip controls all drives, leds, queries sensors, etc. It is also responsible for ejecting the cassette compartment. It controls a driver IC (bridge) via pins 20 and 21, which in turn supplies the charging motor. And exactly the two outputs remained at 0V. When the “Eject” button was pressed, only a few millivolts were measured instead of the 5V. So at first there was a suspicion that the driver IC has an error and is pulling down the outputs of the controller. So the outputs from the controller to the motor driver were separated and 5V directly connected to the motor driver input – and lo and behold, the loading motor was activated. So the problem is with the 80116. After some back and forth I was able to find one of these and exchanged it. Another test pleased me, because the cassette could be loaded again and the head drum started.

And the next problem already appeared. One of the two loading arms only drove half off and then got stuck. That means I also have to disassemble the mechanics of the drive. Said and done. Fortunately, it was only a small bolt that holds a drive lever. This had loosened and slipped out. So the problem was quickly resolved. Now I was finally able to do a function test again. And this time everything worked. The cassette was loaded, the head disk started, the tape was threaded and finally it could be played. After I had tested all functions, the GV-8E can be reassembled. Now he can go to the showcase as a “museum piece”;)


working again


Technical data of the GV-8E:

  • Video recording System: Rotierendes Zweikopf-Helical-Scan-FM System
  • Audio recording System: Rotierender Kopf, FM System
  • Videonorm: CCIR, PAL color
  • Kassettenformat: 8mm Videokassette
  • Bandgeschwindigkeit: SP: 2.0051 cm/s LP:1.0058cm/s
  • LCD Bildschirm: 6.2×4.6cm (3inch Diagonale)
  • Bildschirmtyp: TN LCD/TFT active Matrix mit 92.160 Bildpunkte
  • TV-Tuner: VHF Kanal 2-12, UHF Kanal 21-69
  • Anschlüsse: RF-Antenne, Video Input/ Output Chinch, Audio Input/Output Chinch (mono), Headphone 3.5mm Klinke
  • Energieversorgung 6V (Akku oder Netzadapter)
  • Leistungsaufnahme: 7.1W
  • Abmessungen: 129x67x213mm
  • Gewicht: 1.15kg ohne Akku
Typenschild des GV -8E


Long-term measurements with Keithley and Matlab

Loading

Keithley2000 desk multimeter

The bench multimeter from Keithley is an old companion in the field of measuring instruments. The types of the 2000 series are predominantly used in our laboratories. They are available in different equipment variants with regard to the interfaces to the outside world. Here GBIP bus is of course a standard, as is RS232. The newer devices now have a LAN interface with which communication via the Internet protocol is possible. Each of these interfaces can be used to communicate with the device using “Standard Commands for Programmable Instruments” (SCPI). In this example I will control the Keithley 2000 via Matlab and read out measured values ​​cyclically over a longer period of time, save them in Matlab and finally output them in a plot – virtually configure a simple data logger. The purpose of this setup is to record the voltage curve (or current) of a rechargeable battery or battery of a low-energy device.

backside of the Keithley 2000
GPIB Interface (IEEE488)
RS232 interface

In this example I will use the serial data transmission via the classic RS232 interface, as this is completely sufficient for my application. In addition, I can save myself the installation of the driver packages for the GPIP-USB interface. 🙂 Since many of the current computers and laptops no longer have any RS232 ports, a USB-RS232 adapter (e.g. FTDI232 etc.) is required.

USB-RS232 Adaper am Keithley2000

Once the connection between the multimeter and the computer has been established, communication can take place via a Matlabscript, as in this example. The Keithley only needs to be told that it should “talk” over the serial interface. The following code snippets show how you can easily read out data via SCPI:


serialObject = instrfind('Type', 'serial', 'Port', 'COM26', 'Tag', '');
%serialPort = 'COM23';
%serialObject = serial(serialPort,'BaudRate',9600, 'DataBits',8);

if isempty(serialObject)
serialObject = serial('COM26','BaudRate',57600, 'DataBits',8);
else
fclose(serialObject);
serialObject = serialObject(1)
end

%%%%%%%%%%%%%%%%%%%%%%%%%%%%%%%%%%%%%%%%%%%%%%%%%%%%%%%
%
% Sourcemeter 2000 setup
%
%%%%%%%%%%%%%%%%%%%%%%%%%%%%%%%%%%%%%%%%%%%%%%%%%%%%%%
fopen(serialObject)
% fprintf(serialObject,':*RST')

time = now;
voltage = 0;
%%
figureinstanz = figure('NumberTitle','off',...
'Name','Spannungslogg',...
'Color',[0 0 0],'Visible','off');
plotinstanz = plot(voltage,time,'Color','red');

%% Messzeit und evtl Messintervall
stoptime = 10; %60 seconds
timeInterval = 1; % brauch' ma jetzt nicht

% Messgeraet einstellen
fprintf(serialObject,':SOUR:FUNC:MODE CURR'); % current source selection.
fprintf(serialObject,':SOUR:CURR:MODE FIXED'); % changes voltage mode to fixed
fprintf(serialObject,':SOUR:CURR:LEV 0'); % sets current to 0

fprintf(serialObject,':SENS:FUNC &quot;VOLT&quot;');
fprintf(serialObject,':SENS:VOLT:PROT 4');
%fprintf(serialObject,':SENS:CURR:RANG:AUTO ON');
fprintf(serialObject,':SENS:VOLT:RANG 10');
fprintf(serialObject,':FORM:ELEM VOLT');

% %fprintf(serialObject,':TRAC:COUN 1');
% %fprintf(serialObject,':TRAC:FEED:CONT NEV');
%
%
% fprintf(serialObject,':TRAC:CLE');
%
% fprintf(serialObject,':TRAC:POIN 10');
% fprintf(serialObject,'TRAC:FEED:SENS');
% fprintf(serialObject,'TRAC:FEED:CONT NECT');
% fprintf(serialObject,'TRIG:COUN 10');
% fprintf(serialObject,':OUTP ON');
%
% fprintf(serialObject,':INIT');
% fprintf(serialObject,':TRACE:DATA?');

%% Daten abholen
count = 1; voltage(1)=4
tic;
time=toc;
% while time&lt;=stoptime
while voltage&gt;=1.5
% fprintf(serialObject,':INIT');
% fprintf(serialObject,':TRAC:FEED SENS');
% fprintf(serialObject,':TRAC:DATA?');
%
fprintf(serialObject,':READ?');
voltage(count) = fscanf(serialObject,'%f');
time(count) = toc;
set(plotinstanz,'YData',voltage,'XData',time);
set(figureinstanz,'Visible','on');
pause(timeInterval);
count = count +1;
end

figure(1);
plot(time,voltage);
grid on; hold on;
xlabel('Zeit [s]'); ylabel('Batteriespannung [V]')
title('Spannungsverlauf Batterie 3V Lithium (2032 mit Modul) im default mode');

% fprintf(serialObject,':OUTP OFF');
%% Put the instrument in local mode
fprintf(serialObject,'SYSTEM:LOCAL');
fclose(serialObject);

The following plot shows what such a data log looks like. Here, the voltage curve of a nearly discharged battery is recorded over time until the consumer is switched off.

Read LCR meter via Matlab

Loading

LCR-Meter 4297A Agilent

In this post I would like to devote myself to something else. It’s not about retro technology, it’s about a little thing that makes working in the office/lab easier. One of the many measuring devices I deal with is an old Agilent LCR meter. As is known, the LCR Meter 4297A can be used to measure the inductance, capacitance, etc. of electrical components and generally of structures which are assigned to the electronics / electrical engineering sector. Roughly speaking, the 4297A actually only measures current / voltage, the phase relationship between the two and the energy direction. And at a certain frequency. All parameters such as L, C, R, X, Y, Q, PHI, … are then mathematically calculated and output from these parameters. The frequency here can be set from 1MHz to 3GHz (in 100kHz steps). Ideally, the measuring device can measure not only in one frequency point, but also in many. By “many” is meant here that the measuring device can generate frequency tables with 32 entries. There are eight of these tables. This makes it possible to display the course of a measured variable in the form of a curve. However, this is quite cumbersome. The contents of the tables must be exported and saved manually (as “csv” files) table by table. This means that each table must be selected individually. Then select the “Export List View” dialog – then specify a storage path and file name. Only now are the first 32 records exported. This process must be repeated eight times in total. It is saved on a 3.5 inch floppy disc – the only available medium. You could also hang the 4297A optiona on a LAN and set up file sharing. However, manual export is not spared. The .csv files can now be opened on a “normal” computer. They must then be put together manually in postprocessing. Only now can a diagram be made from the data. Here Matlab from Matworks is a good tool, which is often used in our laboratories as part of training.

NI GPIB – USB Controller

To simplify this cumbersome process considerably, I created a small script that communicates with the measuring device using the SCPI commands (Standard Commands for Programmable Instruments). That means: The measuring device is connected to a PC via a GPIB-USB controller. A Matworks Matlab installation including the required toolboxes is located on the PC. The Matlab script should now simply switch through the tables in sequence and read out the contents of the individual parameters and save them in an array. The content of the arrays is then displayed directly in a plot. However, this method only uses the contents of the tables. It would of course also be possible to set any desired frequency directly in a loop using the script, read out the measured values, select the next frequency, etc. This would max. Total 29990 points over the entire frequency range. The eight tables, each with 32 points, only allow 256 points. For now, however, that is sufficient and also much faster.

Transmission Line 50 Ohm termination resistor
line is terminated

The example shows the impedance curve (Z curve) of a 50 Ohm transmission line. The end of the line is terminated with a 50 ohm resistor. The frequency range is 1MHz to 3 GHz. The situation is different if the line is open or closed briefly. The electromagnetic wave is then not converted into thermal energy at the end of the line, as in the “matched” system, but is reflected back into the system.

line is shortened

The following very simple Matlabscript enables the reading of the measuring device parameters. The script serves as an example of how to get the measurement data quickly. The programming manual of the manufacturer of the LCR meter lists all SCPI commandos and plenty of examples with which you can communicate with the measuring device.


%auslesen der agilent LCR Keule 4287A
%gekodet von ingmar bihlo Ende November 2017

%anschluss über gpib ni adapter
%LCR gpip adresse: 5
%%
%vorarbeiten an LCR Keule
%
% Es müssen 8 Tabellen mit je 32 Punkten definiert sein
% (power und average ist egal, wird nicht ausgelesen)
% die CALibration muss gemacht worden sein
% unter &quot;measurement parameters&quot; muessen vier parameter definiert sein
% zb. Z, qhi, R, L, etc... diese sind dann in den variablen param1 bis 4
% enthalten

%%

% gpib interface oeffnen und identifier lesen
g = gpib('ni', 0, 5);
g.InputBufferSize = 100000; % Set the buffer size
fopen(g);
fprintf(g, '*IDN?')
idn = fscanf(g);
fclose(g);

num1all=0; % initialisieren der variablen für den summenvector
num2all=0;
num3all=0;
num4all=0;
freq=0;

fopen(g);
%read list parameters (frequency points)
fprintf(g, ':SOUR:LIST?');
fpoint=fscanf(g);
listchar=strsplit(fpoint,',');
list=[cellfun(@str2num, listchar(:,1:end))]
clear listchat; clear fpoint;

%analyze list content
points=freq(1);

for i=1:8
%Tables selecten
fprintf(g, strcat(':SOUR:LIST:TABL 0',num2str(i)));
pause(1); %pause 1s zum umschalten der tabelle

%parameter1 abholen
fprintf(g, ':DATA:FDAT1?'); %parameter 1 anfragen
par1=fscanf(g); %parameter 1 holen

string1=strsplit(par1,','); %parameter 1 string nach komma zerlegen
%num1=[cellfun(@str2num, string1(:,1:end))] %parameter 1 strings in dec konvertieren
num1=[cellfun(@str2num, string1(:,1:end))];
num1all=[num1all,num1]; %parameter1 aktuell mit parameter1 aus vorherigem durchlauf concentenaten

fprintf(g, ':DATA:FDAT2?');
par2=fscanf(g);
string2=strsplit(par2,',');
num2=[cellfun(@str2num, string2(:,1:end))]
num2all=[num2all,num2];

fprintf(g, ':DATA:FDAT3?');
par3=fscanf(g);
string3=strsplit(par3,',');
num3=[cellfun(@str2num, string3(:,1:end))]
num3all=[num3all,num3];

fprintf(g, ':DATA:FDAT4?');
par4=fscanf(g);
string4=strsplit(par4,',');
num4=[cellfun(@str2num, string4(:,1:end))]
num4all=[num4all,num4];

%read list parameters (frequency points)
fprintf(g, ':SOUR:LIST?');
fpoint=fscanf(g);
listchar=strsplit(fpoint,',');
listraw=[cellfun(@str2num, listchar(:,1:end))];
list=listraw(:,2:end); %von pos2 das feld schreiben (an pos ist die anzahl der zeilen)

for c=1:3:96
freq=[freq,list(c)]; %von jedem 3. wert aus list ein neues array bilden
end

clear listchat; clear fpoint;

pause (1);
end

%%

%ausgabevariablen festlegen
frequency=freq(:,2:end);
param1=num1all(:,2:end);
param2=num2all(:,2:end);
param3=num3all(:,2:end);
param4=num4all(:,2:end);

%%
% Cell array richtig uma drahn
x1=param1(1:32);
y1=param1(33:256);
param1 = [y1 x1];

x2=param2(1:32);
y2=param2(33:256);
param2 = [y2 x2];

x3=param3(1:32);
y3=param3(33:256);
param3 = [y3 x3];

x4=param4(1:32);
y4=param4(33:256);
param4 = [y4 x4];
%%
%uerberflüssige variablen loeschen
clear c; clear i; clear list; %clear freq;
clear par1;clear par2;clear par3;clear par4;
clear string1;clear string2;clear string3;clear string4;
clear num1all;clear num2all;clear num3all;clear num4all;

fclose(g);

%plotten der ergebnisse
figure(1);
plot(frequency,param1);
grid on; hold on;
xlabel('Frequency [Hz]'); ylabel('Measurement Parameter1 |Z| [Ohm]');
title('Agilent LCR Keule');

figure(2);
plot(frequency,param2);
grid on; hold on;
xlabel('Frequency'); ylabel('Measurement Parameter2');
title('Agilent LCR Keule');

figure(3);
plot(frequency,param3);
grid on; hold on;
xlabel('Frequency'); ylabel('Measurement Parameter3');
title('Agilent LCR Keule');

figure(4);
plot(frequency,param4);
grid on; hold on;
xlabel('Frequency'); ylabel('Measurement Parameter4');
title('Agilent LCR Keule');