Tag Archives: Matlab

Small craft project for the summer time

Loading

solar module

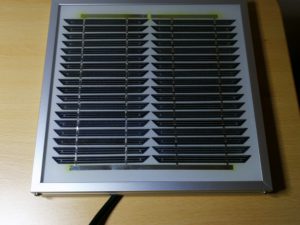
As a mini – craft project for the summertime I call the following tinkering. A small monocrystalline solar module called “SM 6” from a well-known large electronics distributor starting with “C” and ending with “d” plays the main role in the project. The module has a nominal power of 6Wp with a maximum current of 320mA. The rated voltage is 17.3V. The open circuit voltage is 20.8V. The silicon cells are embedded in an EVA (ethylene vinyl acetate) plastic sheet and are UV and moisture resistant. The whole module is about 25cm x 25cm in size. It is thus ideally suited to provide the power to power USB devices. For example, I thought about WIFI IP cams. It should also be possible to charge smartphones or tablets.

In order to be able to do this, the operating voltage of the USB standard (5V) must be generated from the rated voltage of the photovoltaic cell. You could do that easily with a 7805 controller and convert the difference into heat. But this is the least efficient way to get the panel’s energy into a cell phone. Firstly, the internal resistance of the panel depends on the light intensity, which has a major impact on the efficiency of unmatched load resistors. On the other hand, a series regulator is a power shredder, since the difference between input voltage and regulated output voltage is converted into power loss, ie heat, during the flow of current. Here you are better served with a switching converter (buck converter).
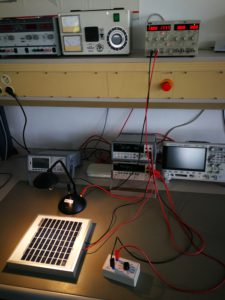


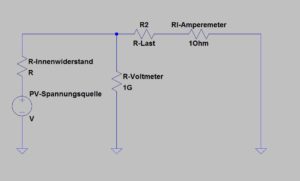
In a simple laboratory setup, the behavior of the panel can be examined. For this purpose, the open circuit voltage of the panel is measured at different illuminance levels. Subsequently, the panel is loaded with different resistance values ​​and the current through the load as well as the voltage at the panel are measured. The measured values ​​are recorded and the Ri (internal resistance of the source) is calculated. The following circuit diagram shows the measurement setup:
measurement setup – schematic
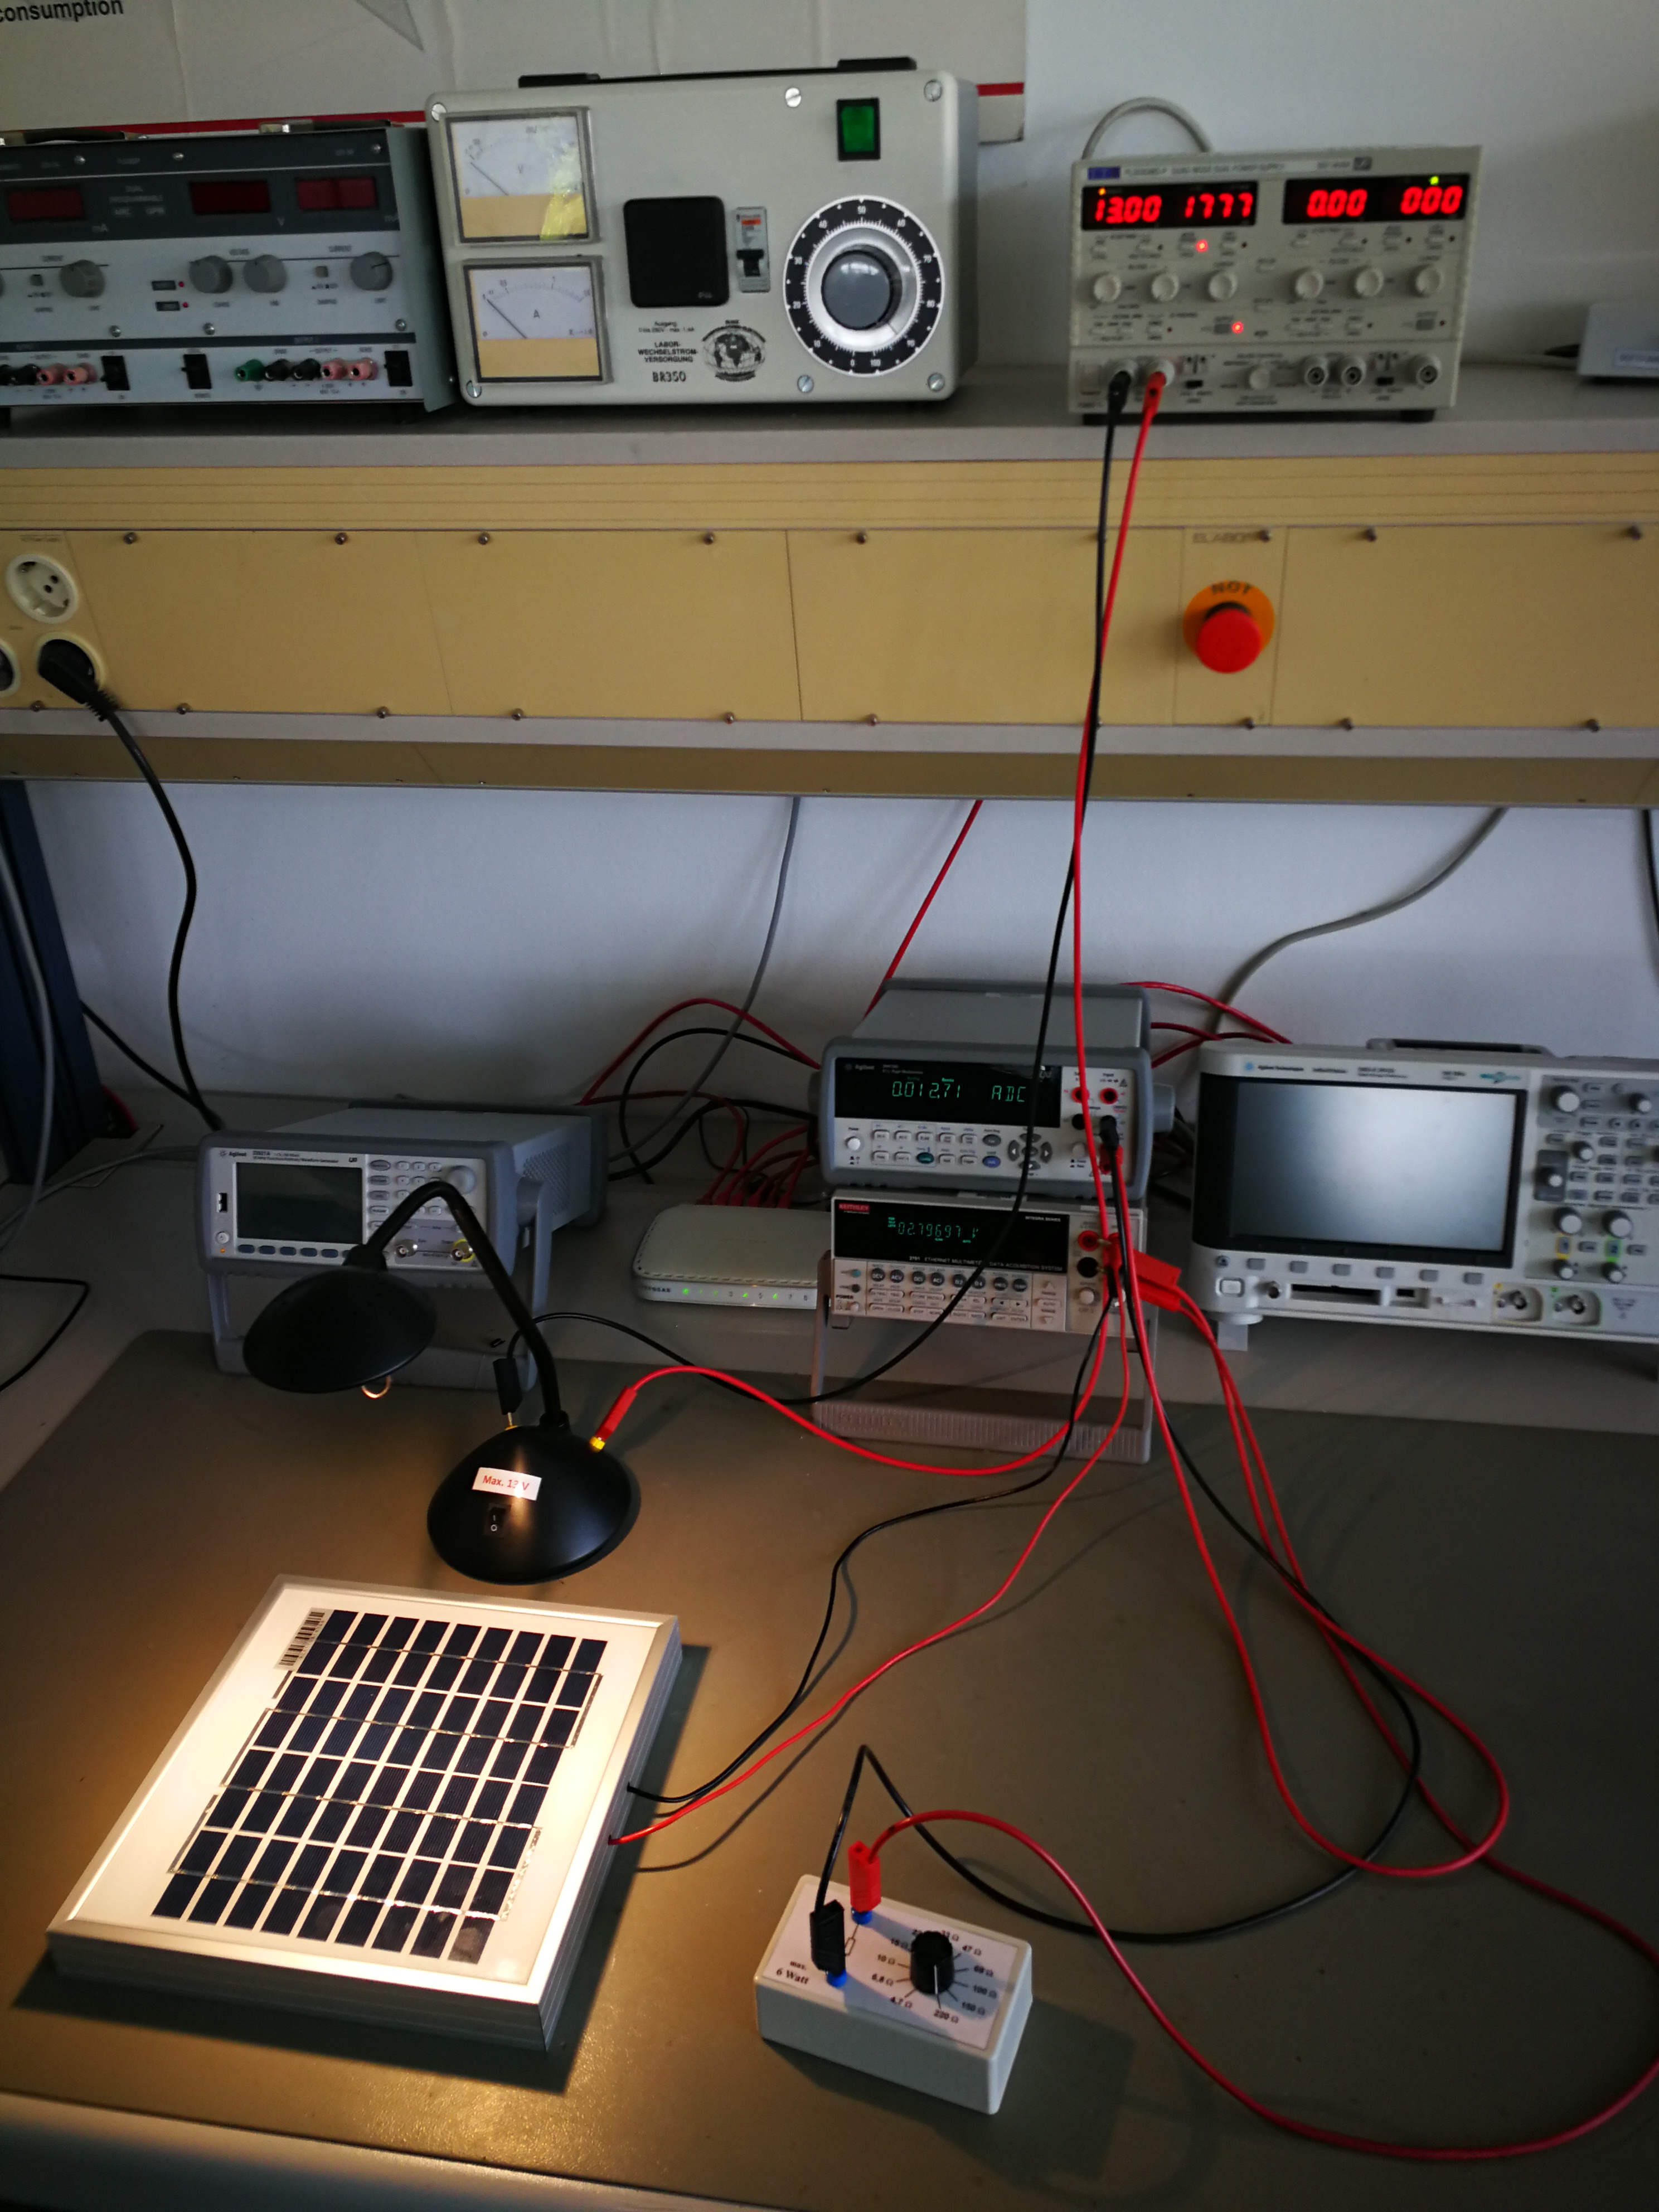
The ammeter is an Agilent and Voltmeter Keithley 2701 table multimeter. These gauges can both be controlled via SCPI commands. The interface is a LAN port. This makes it easy to implement an automated measurement process via a PC and a suitable script. And since Matlab offers a very convenient way to script, it’s also used right now. In order to be able to measure in a laboratory and have approximately the same environmental conditions, a table lamp with halogen bulb is used instead of the sun. The brightness of the lamp is easily adjusted by supplying it with a laboratory power supply of 0-13V. Of course, the laboratory power supply can also be controlled by Matlab.
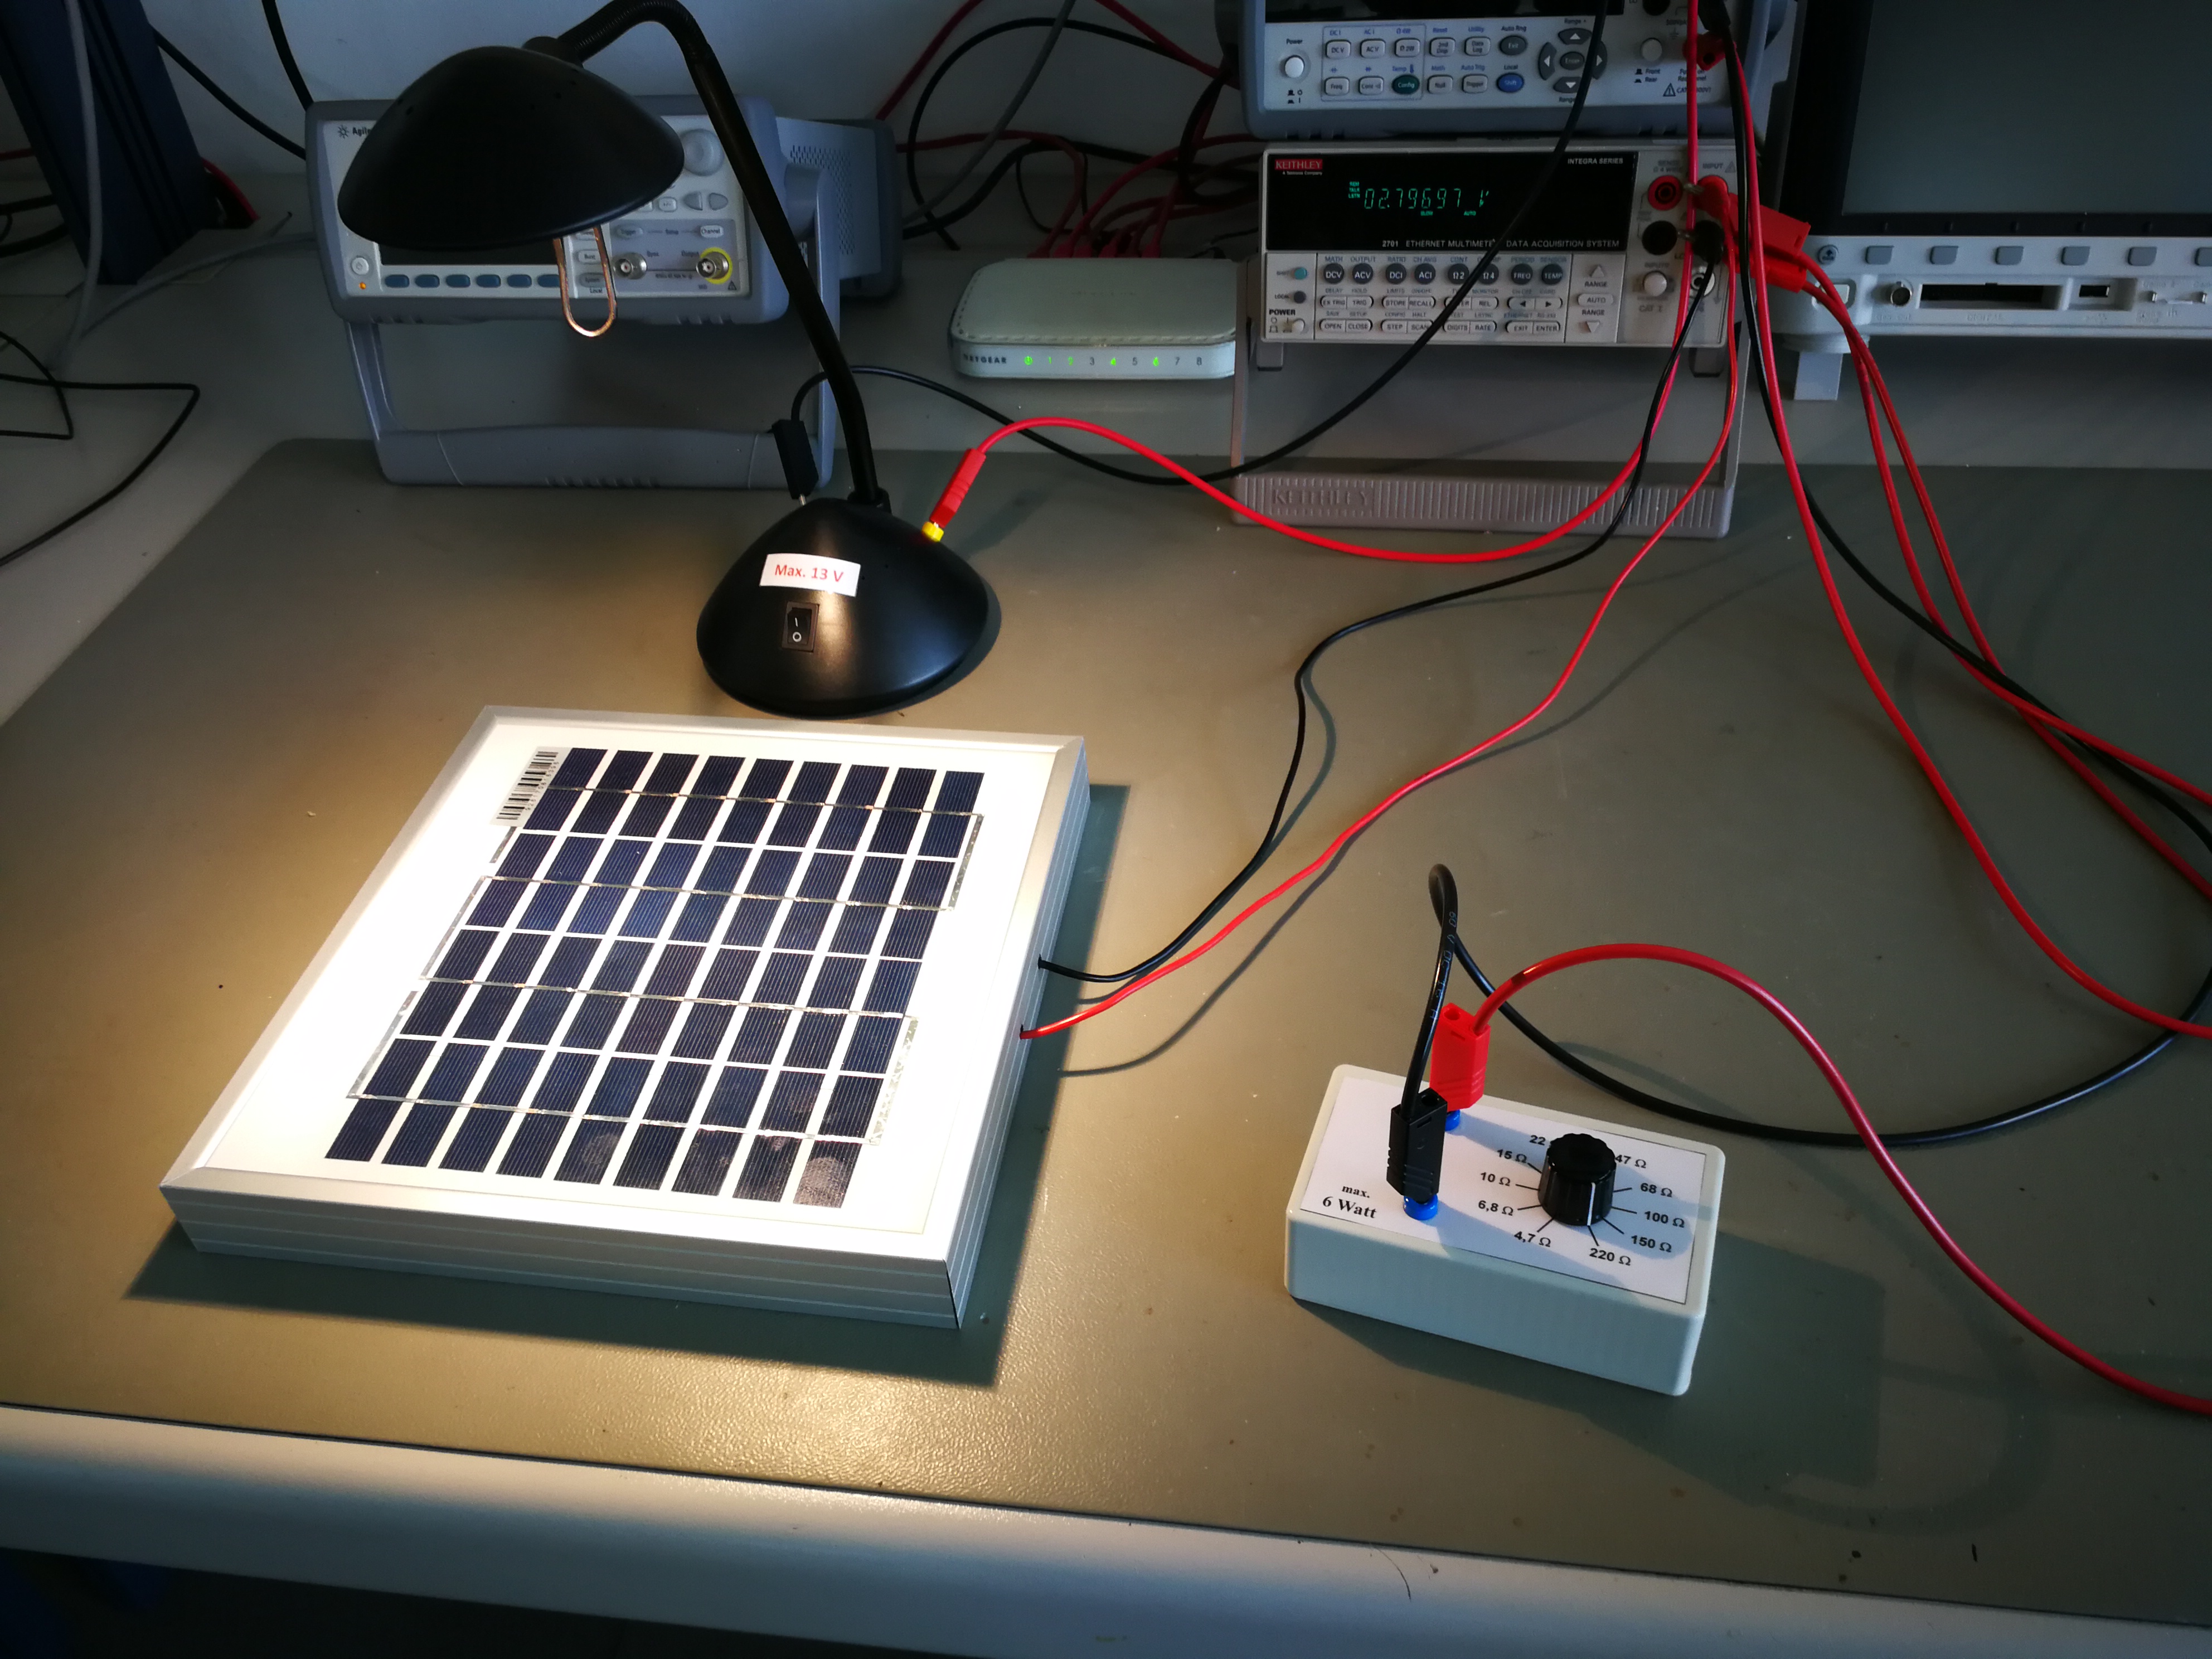
measurement setup with lamp as “sun”

The lamp is placed at a distance of 25cm in the middle of the panel. In order to get a feeling of which illuminance is achieved with the lamp, a reference measurement is taken with a luxmeter. That is, the lamp goes through the power ramp of 0-13V and the lux meter measures the illuminance at a distance of 25cm under the lamp. The whole thing is resolved in 0.5V steps. This results in a curve that looks like this:
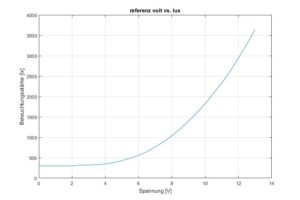
Voltage on the lamp results in illuminance

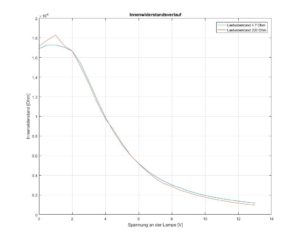
Now the measurement can begin. Resistors are manually connected to the panel as a load resistor and current and voltage are measured at each brightness level. There are eleven load resistance values ​​ranging from 4.7 ohms to 220 ohms connected in sequence. An idle measurement is then of course made without load resistance. The following graph shows the calculated internal resistance for two loads of the panel over the brightness curve of the lamp in lux and in the other graph over the voltage at the lamp (for better scaling). The internal resistance of a source is calculated from the open circuit voltage of the source minus the voltage under load, divided by the current. With the difference between the no-load and load voltage, the voltage drop at the internal resistance is obtained. Since the load is also known as the current, it is only necessary to use Ohm’s law to obtain the resistance value …
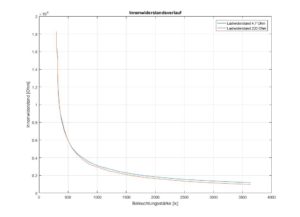
Internal resistance vs. illuminance

Internal resistance vs. Voltage on the lamp

Since some clarifications about the behavior of the PV cell have now been eliminated, I can briefly report on the structure of the voltage converter. As previously announced, a switching converter is the more efficient way to adapt the energy to the consumer. Here comes an LM2596S used. The LM 2596 is a “Simple Switcher Power Converter” that switches at 150kHz and can supply a load with 3A.) Here is an overview of the functions:

  • 3.3-V, 5-V, 12-V, and Adjustable Output Versions
  • Adjustable Version Output Voltage Range: 1.2-V to 37-V ± 4% Maximum
    Over Line and Load Conditions
  • Available in TO-220 and TO-263 Packages
  • 3-A Output Load Current
  • Input Voltage Range Up to 40 V
  • Excellent Line and Load Regulation Specifications
  • 150-kHz Fixed-Frequency Internal Oscillator
  • TTL Shutdown Capability
  • Low Power Standby Mode, IQ, Typically 80μA
  • Uses Readily Available Standard Inductors
  • Thermal Shutdown and Current-Limit Protection

(source: datasheet from vendor TEXAS Instrument)

With this switching converter and a few other components can quickly assemble a circuit and transform with the layout tool “Eagle” into a board. However, this circuit is so simple that it only works as efficiently as possible with the advantages of the LM2596, but does not perform any power tracking. This means that the load representing the circuit for the solar cell is not adapted to the internal resistance of the solar cell.
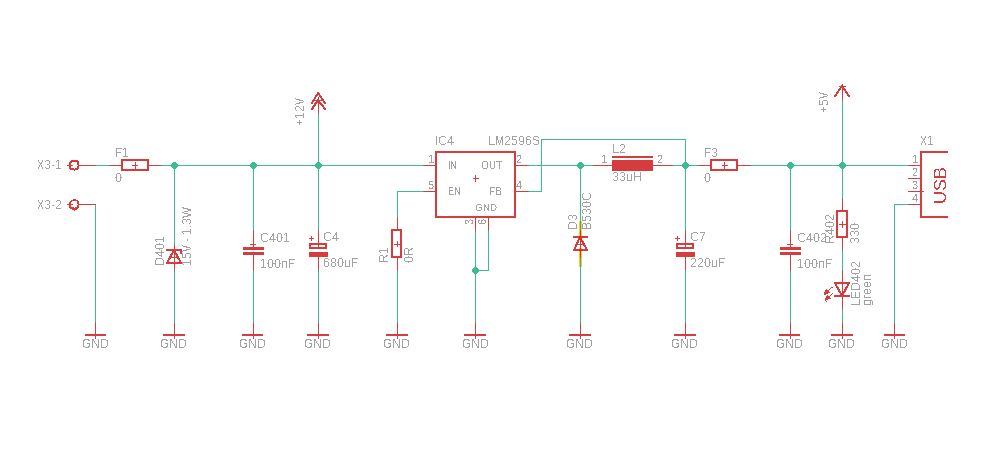
 

Circuit diagram of the DC-DC converter

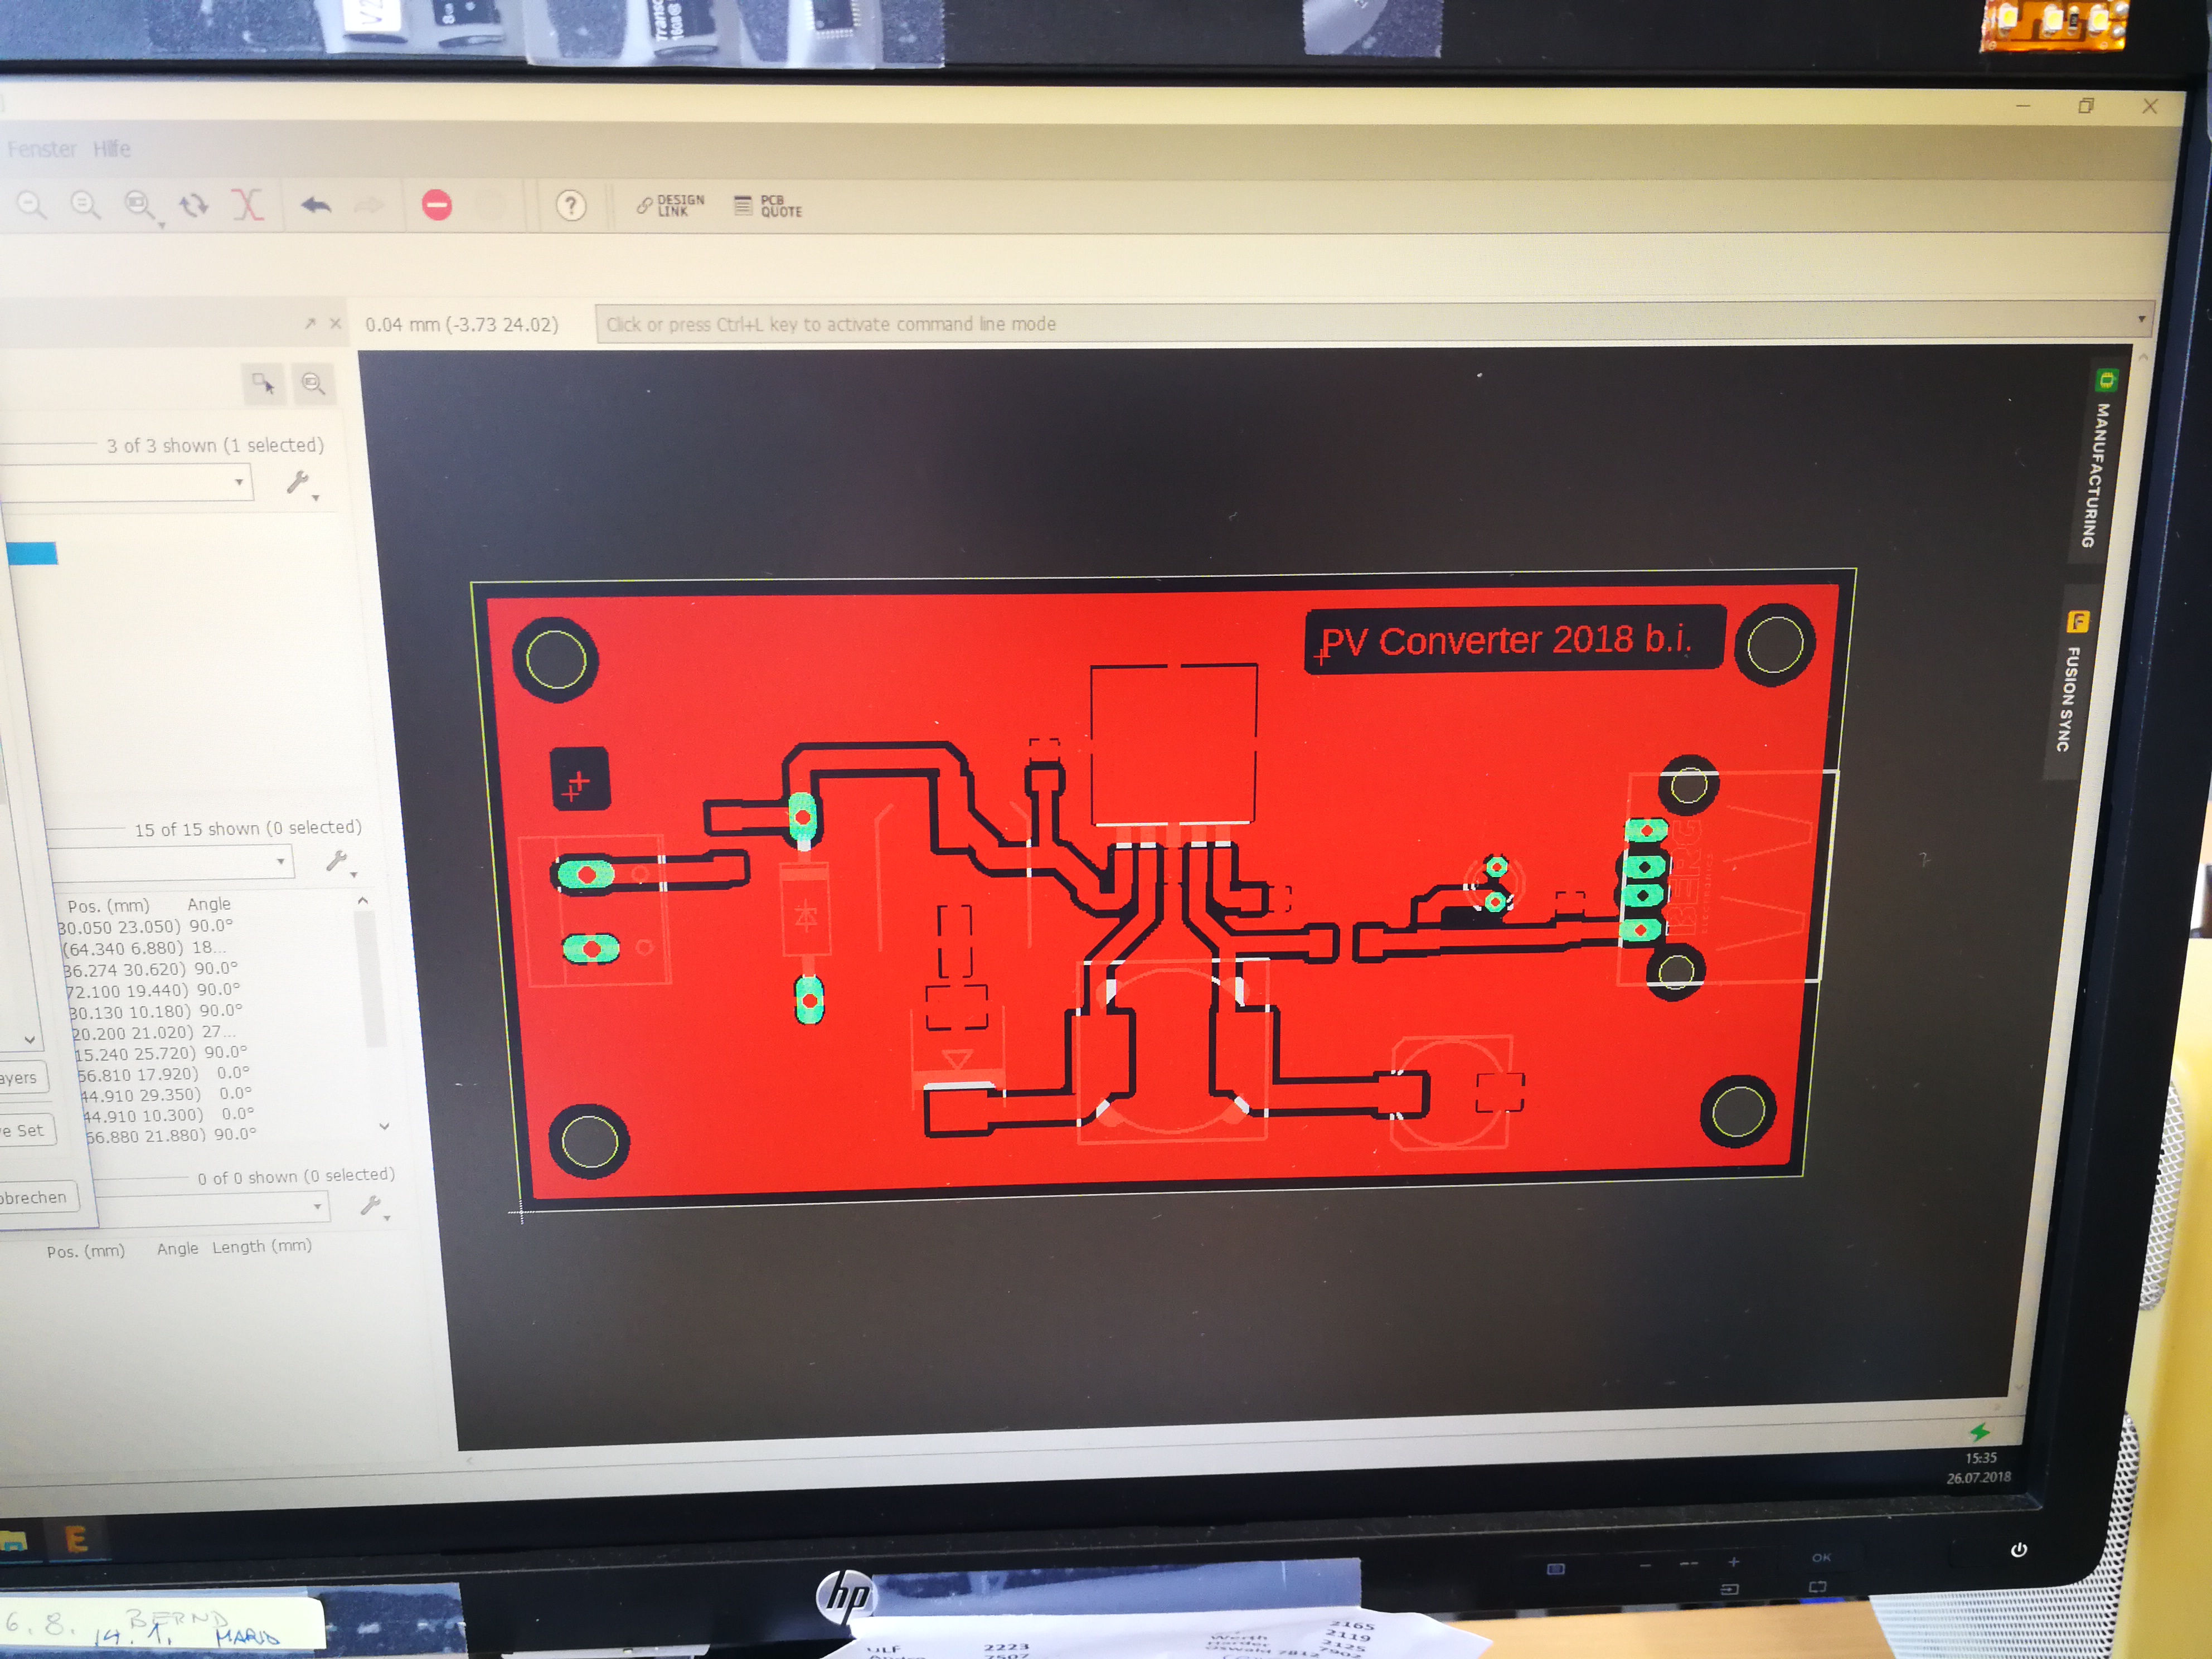
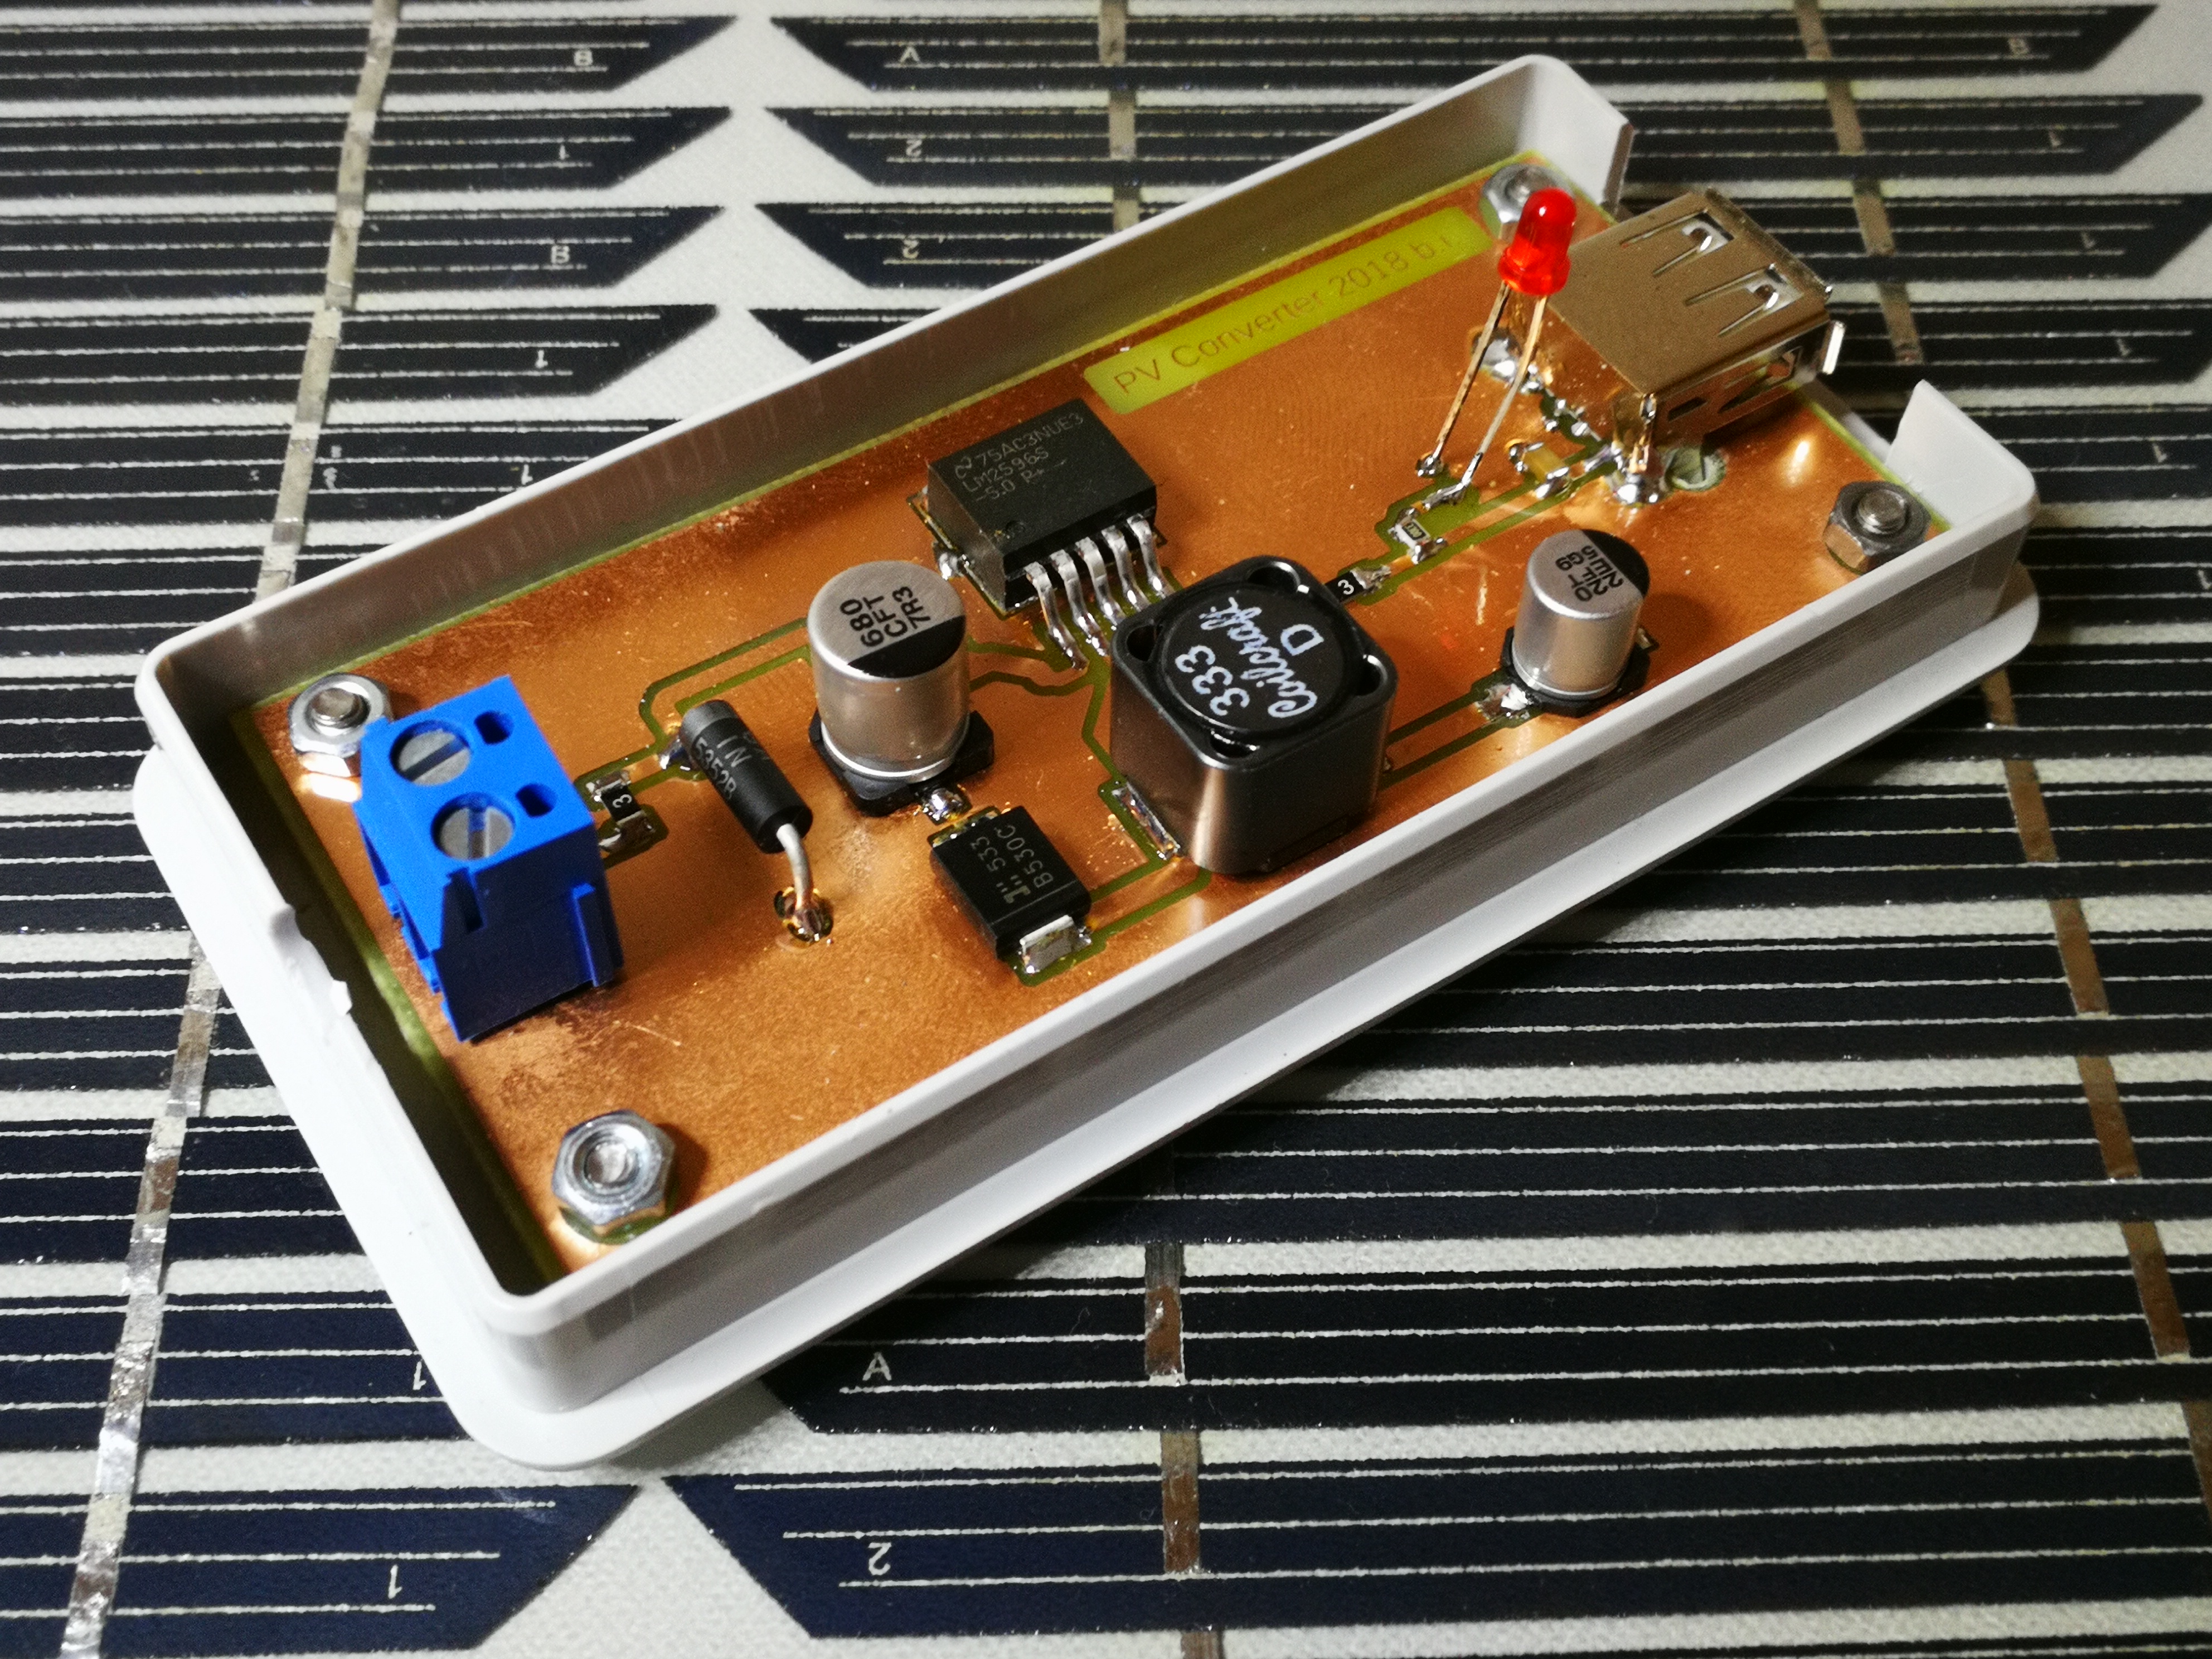
From this circuit, a simple layout was created, a board etched and equipped. A USB socket on the output allows the direct connection of USB devices. To make the whole thing look a bit reasonable, I have donated the board still a small plastic casing …

measurement setup
Switchable load resistors
Layout on the computer
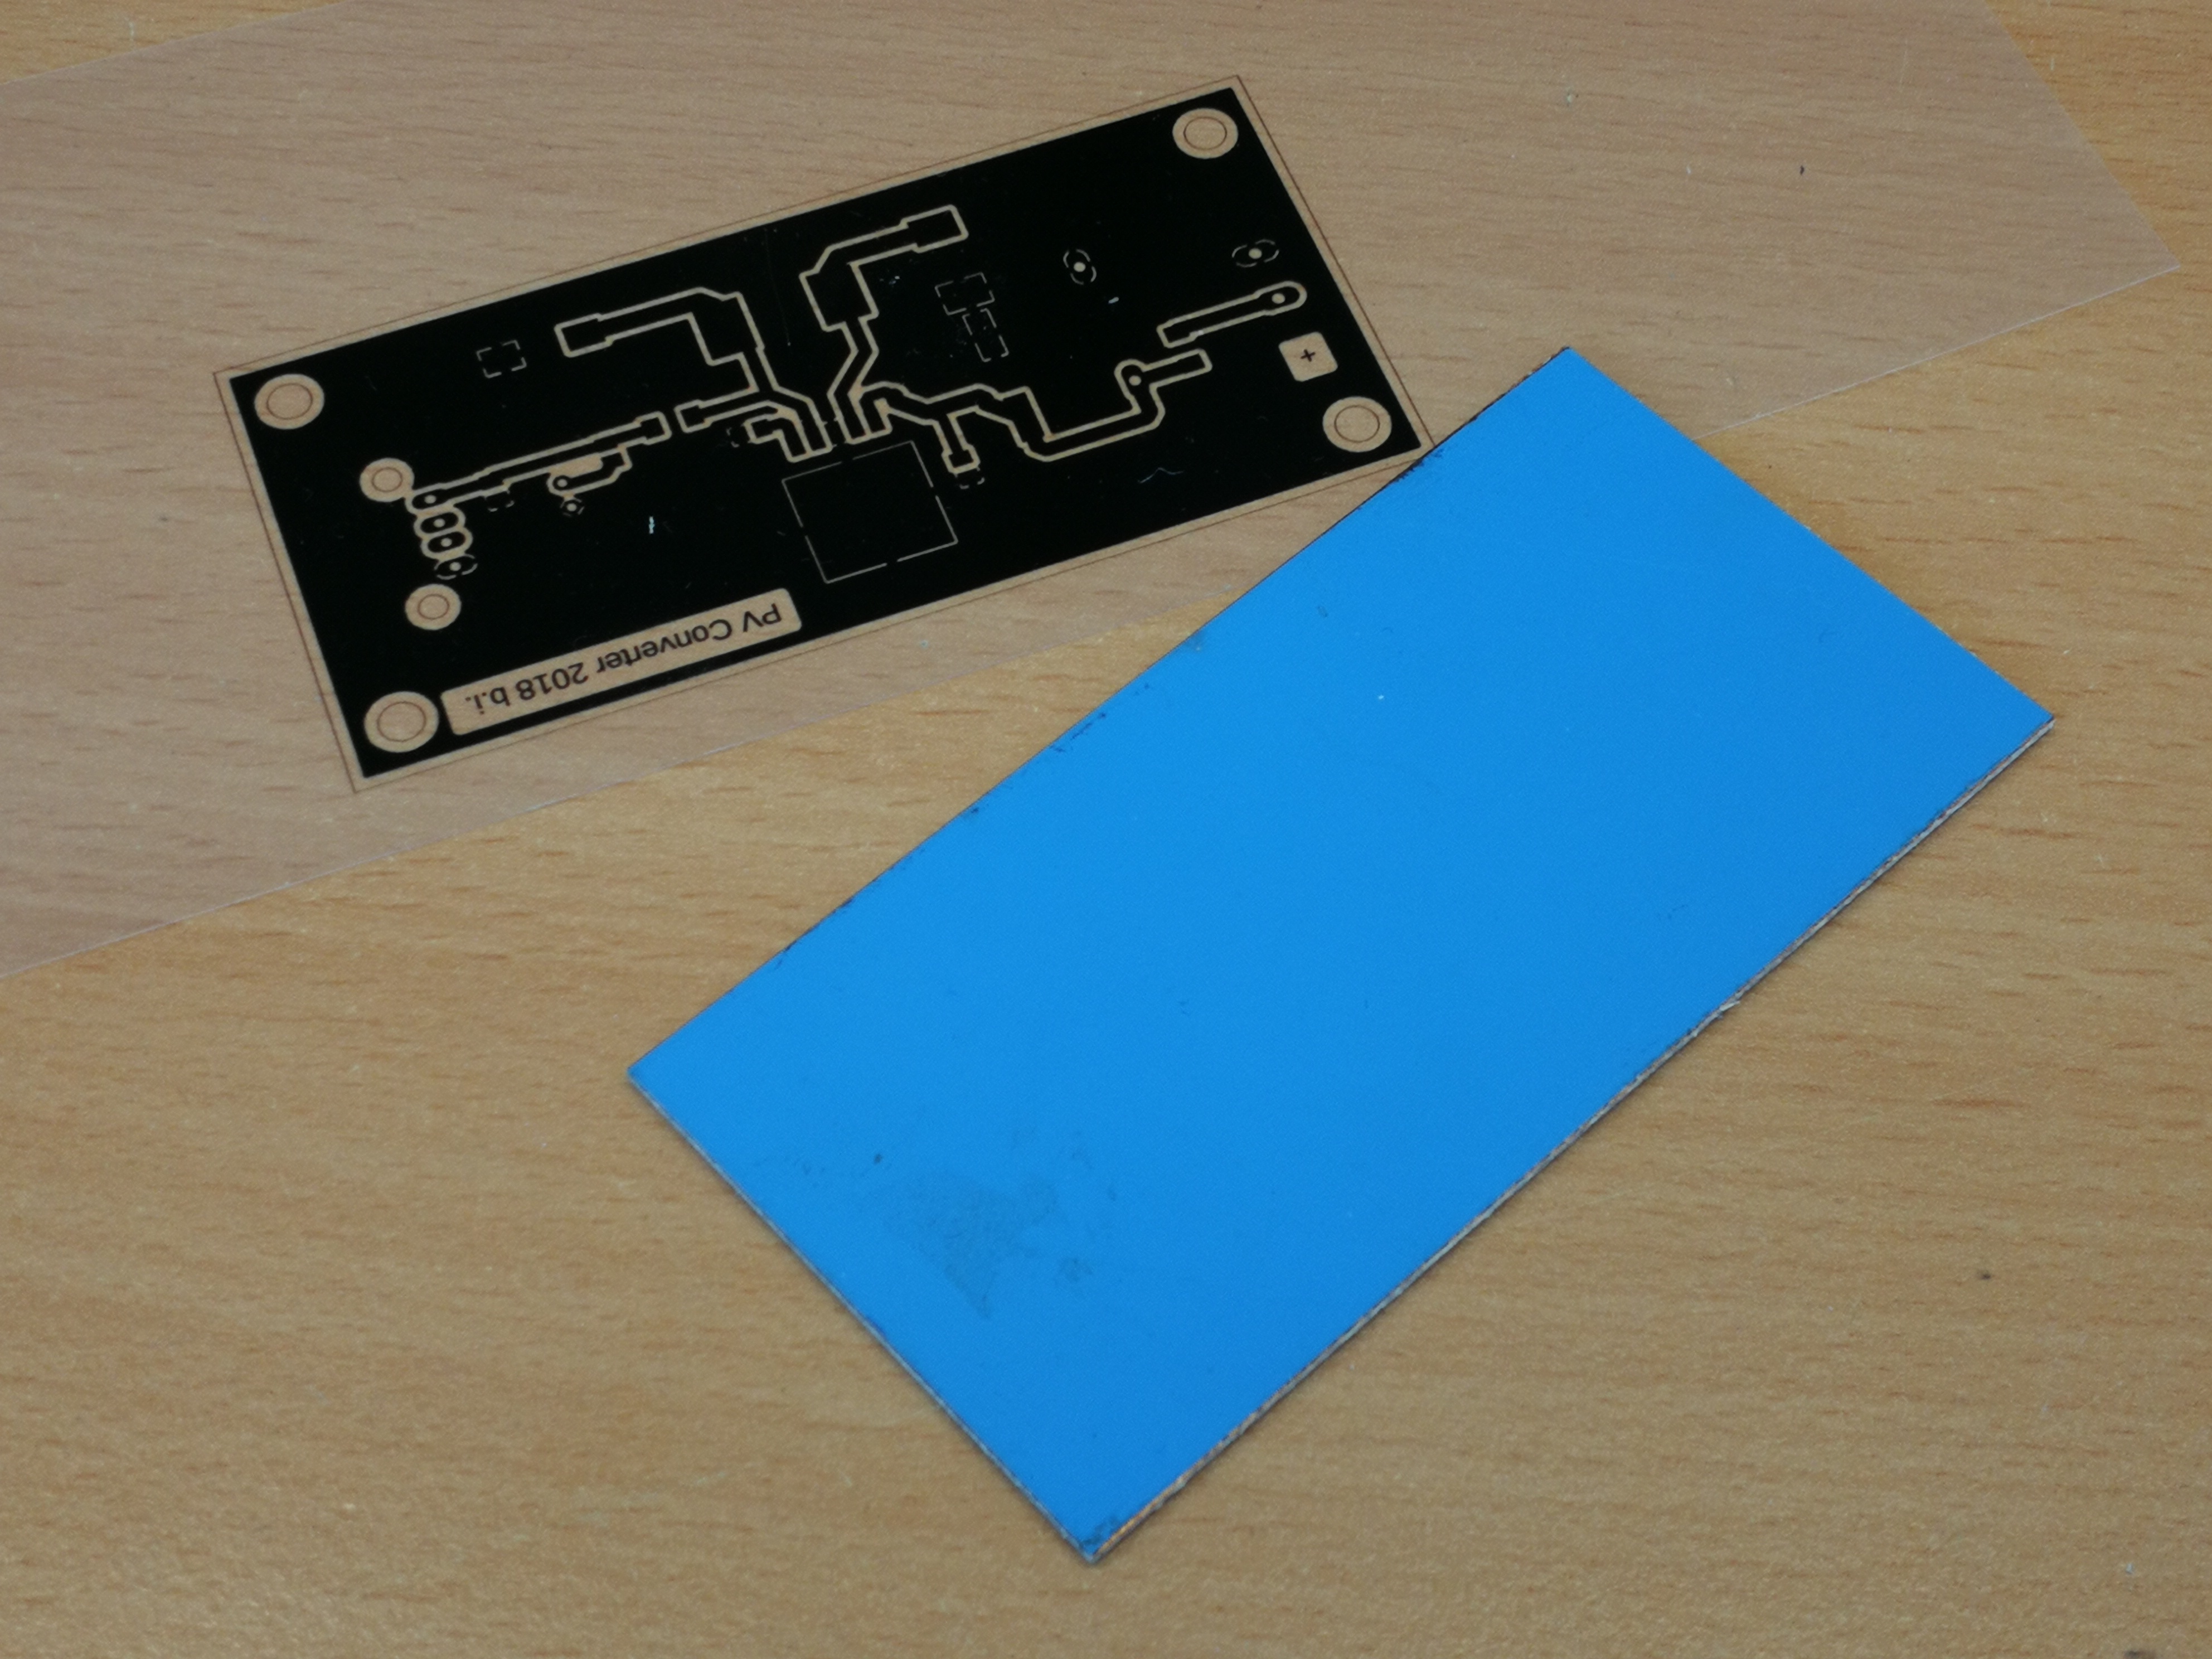
Foil for creating the printed circuit board
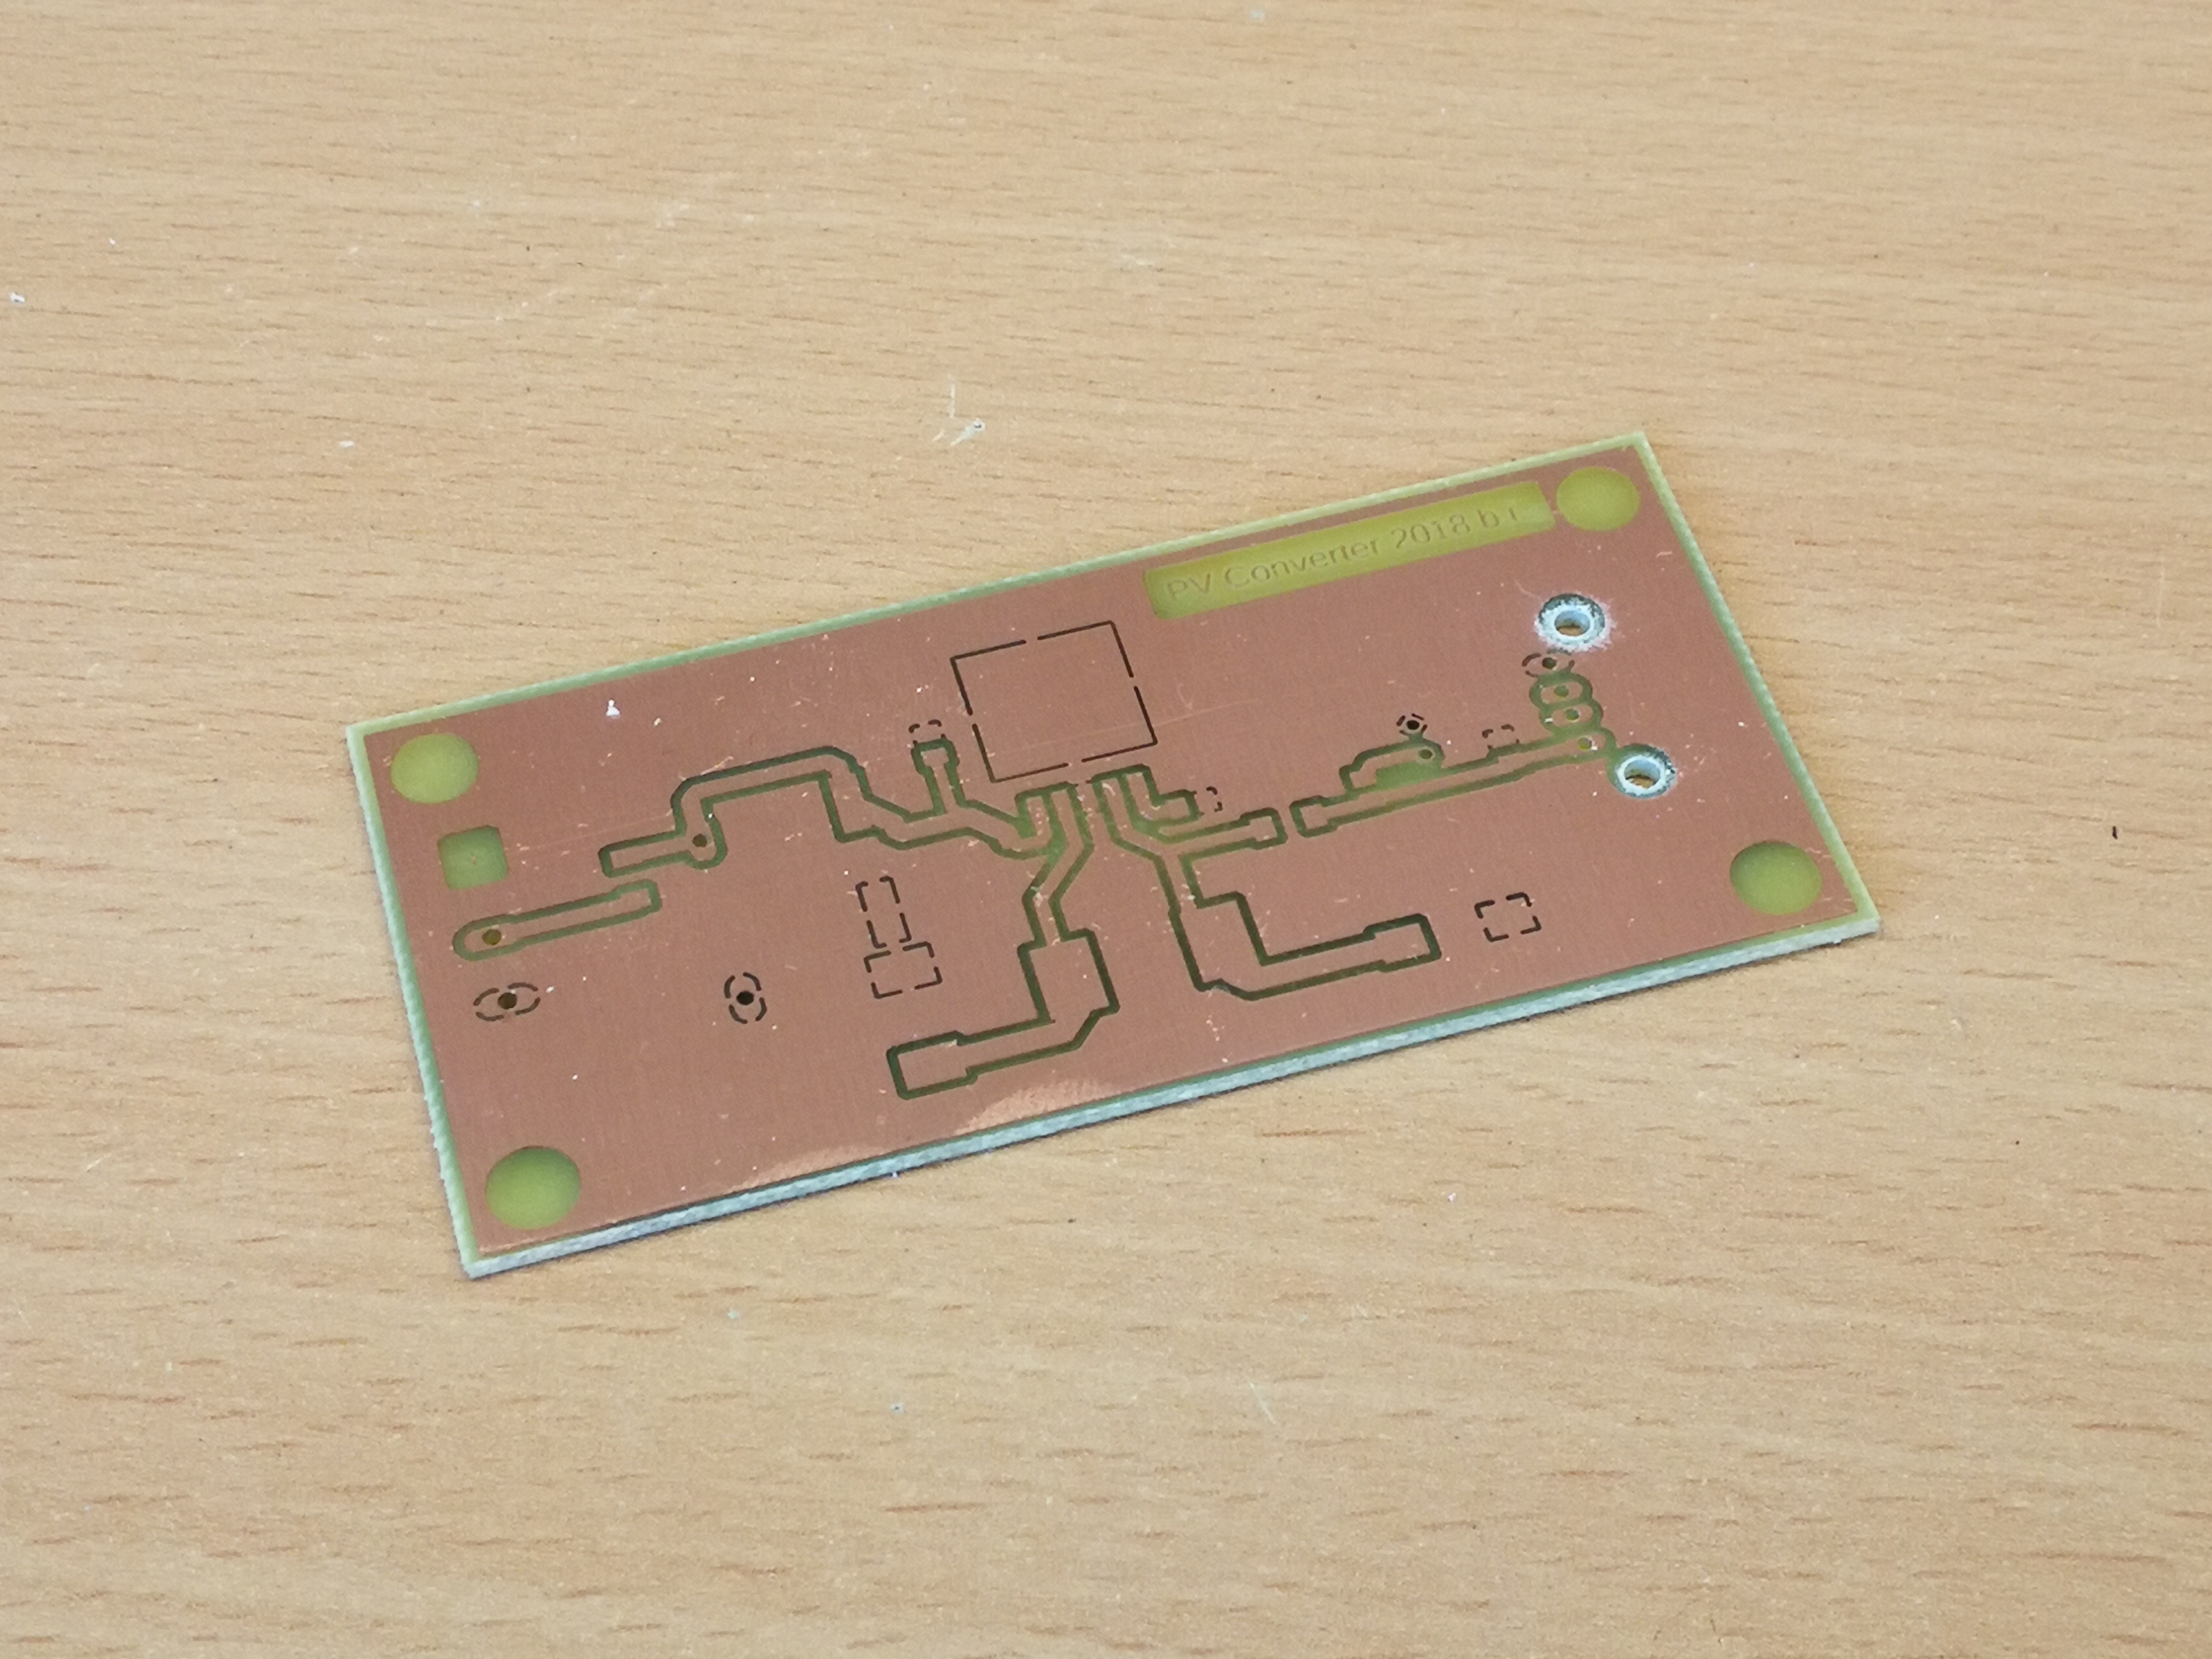
Etched PCB
Etched PCB
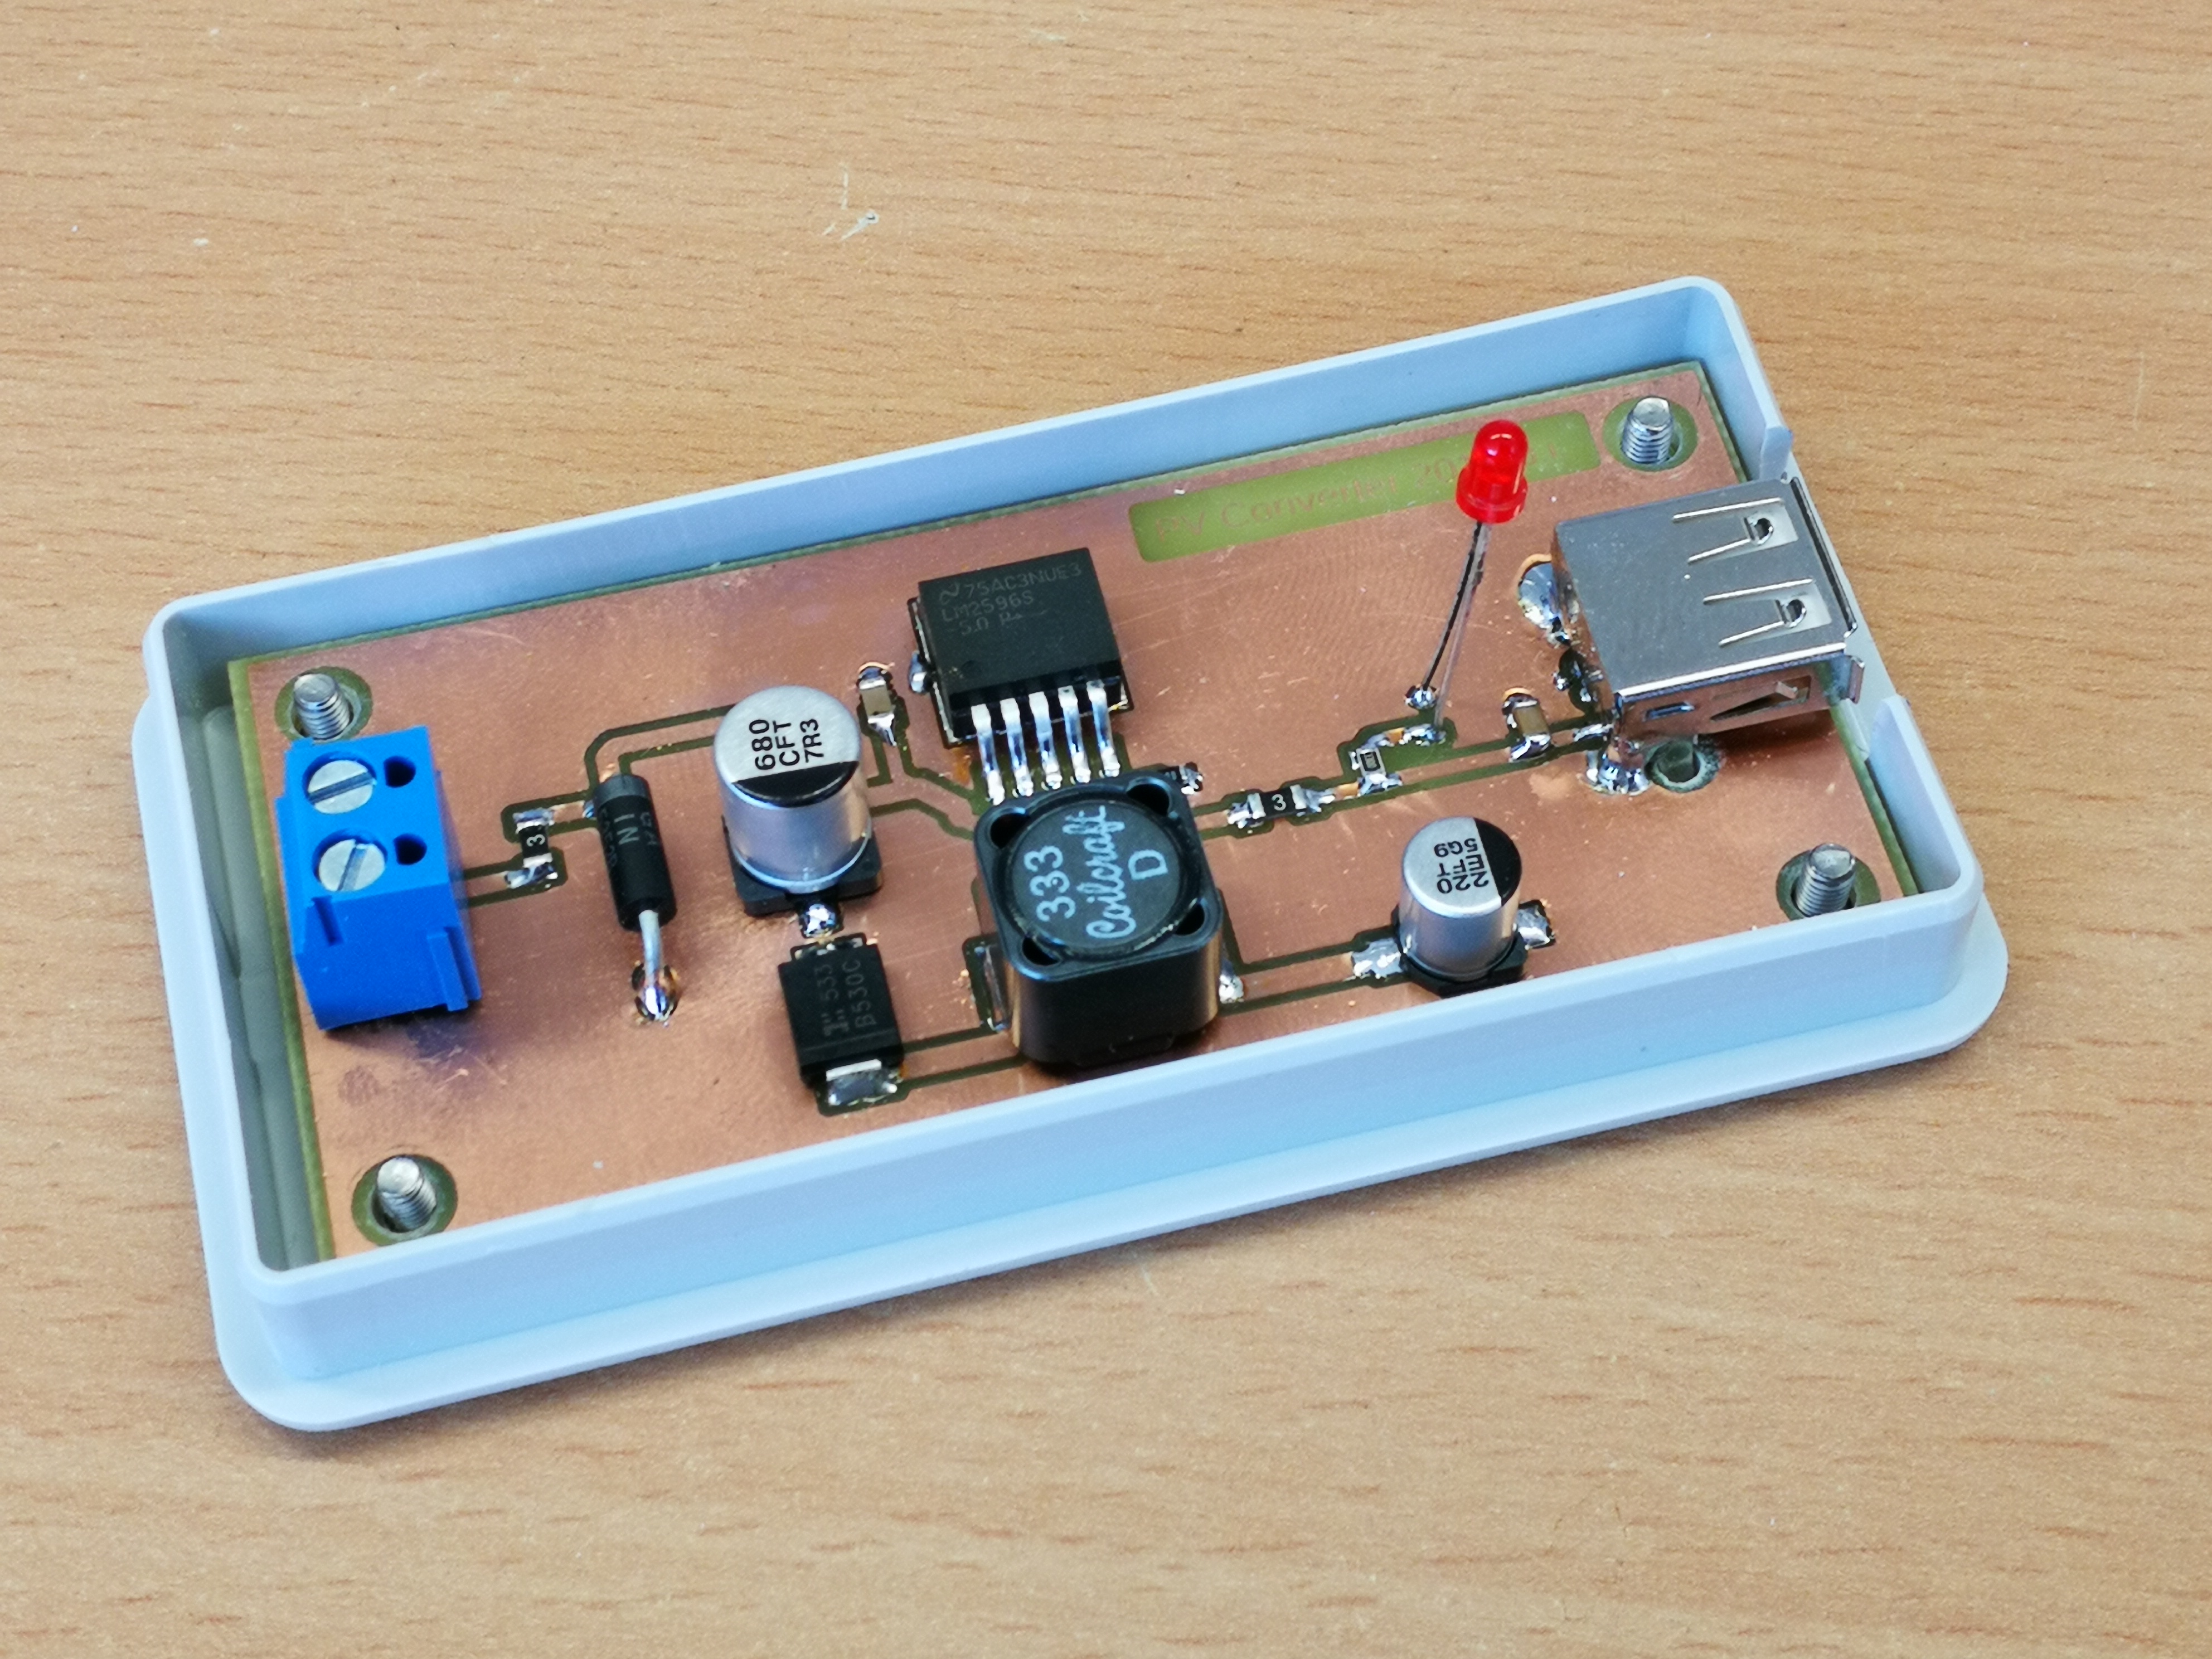
Finished circuit

Circuit diagram of the DC-DC converter

A simple layout was then created from this circuit, a circuit board was etched and assembled. A USB socket at the output enables direct connection of USB devices. To make the whole thing look a little sensible, I donated a small plastic housing to the circuit board …

Measurement setup
Switchable load resistors
Layout on the computer
Foil for creating the printed circuit board
Etched PCB
Assembled PCB
Finished circuit

Data Node with Arduino

Loading

Unfortunately, the intervals in which I find some time to write a new post for the blog have not gotten shorter. But post a post per month, I think … 🙂

This time it’s not a retro craft project from the local Gefielden or a restoration of an old device, but again something about Arduino. The idea – to build a sensor that, as always, transforms a physical quantity into an electrical signal. This is nothing special and what kind of sensor it will be, I will not describe for the time being. But there should not be a sensor board, but many. And these sensor boards short “sensors” are to be networked together in a two-dimensional matrix. You can imagine it as a chessboard, with each of the chessboard panels representing a sensor. This network of sensors – ie sensor nodes – should then be connected via a transfer point to a computer and output the sensor data of the respective field. It should then also be possible to remove individual fields from the network without the remaining network losing its function.

The whole system should be as simple and cheap as possible. And so a system concept was quickly developed in which the nodes communicate via the I²C bus and send their data to a master. The following diagram is intended to illustrate this.

This concept, I thought, is easiest to implement with an ATmega microcontroller. The has enough IO’s, an I²C bus and UART onboard, as well as analog inputs and requires little component peripherals to bring it to life in its own layout. And there is nothing faster to do such a test setup of such a node network than to use the well-known Arduino development boards. I have chosen the cheapest version for a test setup -> the Chinanachbau of the ArduinoUno (Joy-IT UNO) with the Atmga328 in the capped DIL housing.

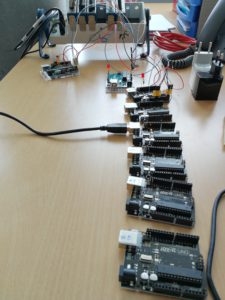
Joy-It Uno Boards

The picture shows ten of these microcontroller boards. Of these, one should be used as a bus master and nine as slaves. Of course, each of these slaves has a unique bus address, which only occurs once in the system. In the test setup, this bus address is permanently assigned via the program code, since anyway each Arduino must be connected to the computer in order to carry out the program upload. Of course, that should look different later. Because the Arduino is on the Atmega328 chip, its quartz and the few resistors reduced on the sensor board with gelayoutet. The chip should then be programmed via the ISP pins. Of course, as many boards do not always customize the program code and they all have the same Flash file, I want to set the sensor address with a 7-bit DIP switch. A 4021 Cmos Static Shift Register is supposed to read the bits after the controller is powered on and push them serially into the controller. The resulting value is then available as a bus address in a variable.

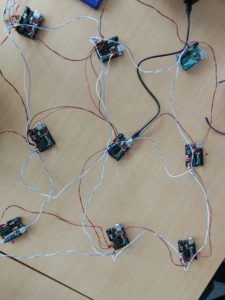
Each of these slaves with their individual bus address is now queried in sequence by the master node, which state it has and whether it should switch an output or not. That is, the node has only one DO (digital output) with which it can, for example, turn an LED off and on and interrogate one or more DIs (digital input) which polls a state, for example a simple switch. These functions are stored in 2 bits of a byte. Another byte is used to transfer the bus address. So two bytes are sent over the bus. The picture below shows the test setup with the “UNO boards”

All Arduinos are connected to I²C data bus and power supply

The process is as follows:

MASTER:
The master node sends a request after the series to all slave addresses and a switch command (which comes from all nodes of a TEST push button input on the master) for the LED output of the node and sees if a response comes back or not. If no answer comes, the node is not in the network or is defective. If there is an answer, this consists of the address of the node and its status byte. This information is transmitted via an RS232 terminal to the computer connected to the master. Thus, for example, the switching status of each individual node can be displayed on the screen via a visualization using (NI LabView, or Matlab or similar). By adapting the master program, it is also possible to switch the LED outputs of the slaves via the computer.

SLAVE:
When the master node requests data from the slave, the slave sends back two bytes. Where byte0 again is the slave ID (ie bus address) and byte1 is the data. Byte1 actually consists of only two bits encoded as follows (in decimal representation):
 0 = LED off| Sensor not triggered
 1 = LED on | Sensor not triggered
 2 = LED off | Sensor triggered
 3 = LED on | Sensor triggered

The program code as an example:

 1
 2
 3
 4
 5
 6
 7
 8
 9
10
11
12
13
14
15
16
17
18
19
20
21
22
23
24
25
26
27
28
29
30
31
32
33
34
35
36
37
38
39
40
41
42
43
44
45
46
47
48
49
50
51
52
53
54
55
56
57
58
59
60
61
62
63
64
65
66
67
68
69
70
71
72
73
74
75
76
77
78
// I2C Slave Code
// 16.05.2018 
// ver 1.3
#include <Wire.h>
#define ADDRESS 2     // adresse des slave knotens
#define PAYLOAD_SIZE 2 // anzahl der bytes  die vom masterknoten zu erwarten sind
int LED=12;            // indicator led an pin D12
int SENSOR = 8;        // sensor input an pin D8
bool actionState=0;      // sensor zustand
int busstatus;  // statusvariable 
                       // 0 = LED aus | sensor nicht belegt
                       // 1 = LED ein | sensor nicht belegt
                       // 2 = LED aus | sensor belegt
                       // 3 = LED ein | sensor belegt
 
bool sensled=0;          // sensor LED
byte nodePayload[PAYLOAD_SIZE];

void setup()
{
  pinMode(LED, OUTPUT);         //sensorLED
  pinMode(SENSOR, INPUT);       //Sensor 
  Wire.begin(ADDRESS);          // Activate I2C network
  Wire.onReceive(receiveEvent);
  Wire.onRequest(requestEvent); // auf master anforderung warten
                      //  // debug interface
                      //  Serial.begin(9600); 
}

// *********************************mainloop****************************************************
void loop()
{ 
  delay(5);
  
   if(sensled){digitalWrite(LED, HIGH);}
         else{digitalWrite(LED, LOW);}

  actionState = digitalRead(SENSOR);  //Sensoreingang abfragen        
   if((actionState==1)&&(sensled==1)) {busstatus=3;}
   else if ((actionState==0)&&(sensled==1)) {busstatus=1;}
   else if ((actionState==1)&&(sensled==0)) {busstatus=2;}
   else if ((actionState==0)&&(sensled==0)) {busstatus=0;}

                      //  Serial.println("######################");
                      //  Serial.print("busstatus neu setzen ");
                      //  Serial.println(busstatus);
                      //  Serial.print("sensled LED            ");
                      //  Serial.println(sensled);
                      //  Serial.print("actionState           ");
                      //  Serial.println(actionState);
                      //  Serial.println("######################");
  nodePayload[0] = ADDRESS;                  // Adresse in byte0 zurücksenden.  
  nodePayload[1] = busstatus;                //byte 1 ist die statusinfo der LED
}


// *********************************************************************************************
void requestEvent()
{ Wire.write(nodePayload,PAYLOAD_SIZE);  
  Serial.println("bytes status schreiben");
  Serial.println(nodePayload[0]);
  Serial.println(nodePayload[1]);
  delay(5);
}

// *********************************************************************************************
void receiveEvent(int bytes)  //einen wert vom I2C lesen
      
{
  
  busstatus = Wire.read(); //If the value received was true turn the led on, otherwise turn it off  
                              //  Serial.println("status empfangen");
                              //  Serial.println(busstatus);
  if((busstatus==1)||(busstatus==3)){sensled = 1;}
                                else{sensled = 0;}
                                              
}


The bus address must still be entered individually in this slave code. In the next version, the previously described “serializer” of the parallel dip-switch variant will be implemented. The following code example is from the master node, which reads out the slaves and sends a LED pattern to the sensor slaves using the test button:


  1
  2
  3
  4
  5
  6
  7
  8
  9
 10
 11
 12
 13
 14
 15
 16
 17
 18
 19
 20
 21
 22
 23
 24
 25
 26
 27
 28
 29
 30
 31
 32
 33
 34
 35
 36
 37
 38
 39
 40
 41
 42
 43
 44
 45
 46
 47
 48
 49
 50
 51
 52
 53
 54
 55
 56
 57
 58
 59
 60
 61
 62
 63
 64
 65
 66
 67
 68
 69
 70
 71
 72
 73
 74
 75
 76
 77
 78
 79
 80
 81
 82
 83
 84
 85
 86
 87
 88
 89
 90
 91
 92
 93
 94
 95
 96
 97
 98
 99
100
101
102
103
104
105
106
107
108
109
110
111
112
113
114
115
116
117
118
119
// I2C masterknoten 
// 16.05.2018 
// ver 1.2
// changes abfrage wenn kein knoten am bus dann 255 ausgeben
#include <Wire.h>

#define busbytes 2          // wievele byte vom I2C knoten zu erwarten sind
#define maxKNOTEN  10       // anzahl der zu scannenden slaves
#define startKNOTEN 2       // startadresse der slaves
#define DELAY 5             // einfach ein delay ....

int i; int j=0;
int buttonPin = 12;
int testbut = 0; int anim = 0;
int buttonState = 0;
int DATEN[busbytes];
int adresse; int busstatus;  
byte sensorbelegt; byte ledsensoron;

                       // 0 = LED aus | Sensor nicht belegt
                       // 1 = LED ein | Sensor nicht belegt
                       // 2 = LED aus | Sensor belegt
                       // 3 = LED ein | Sensor belegt

int leddat1[] = {1,1,1,1,0,1,1,1,1}; // -
int leddat2[] = {0,0,0,0,1,0,0,0,0}; // |

void setup()
{
  Serial.begin(9600);  
  Serial.println("MASTER-KNOTEN");
  Serial.print("Maximum Slaveknoten: ");
  Serial.println(maxKNOTEN);
  Serial.print("Datengroesse in byte: ");
  Serial.println(busbytes);
  Serial.println("***********************");
  
  Wire.begin();                 // Activate I2C link
  pinMode(buttonPin, INPUT);    // test-tastereingang festlegen
}


//#####################################################################################################
void loop()
    
{
  for (int Knotenadresse = startKNOTEN;         //alle knoten scannen
           Knotenadresse <= maxKNOTEN; 
           Knotenadresse++) 

        
    //################################################################################################       
    { 
     // testbut = 0;  
     anim = 0;   
    Wire.requestFrom(Knotenadresse, busbytes);        // daten vom jeweiligen knoten anfordern
                                                 
           DATEN[0]=255; DATEN[1]=255;   // wenn kein knoten dann auf 255 setzen    
          if(Wire.available() == busbytes) {                                    // wenn knoten und daten dann
            for (i = 0; i < busbytes; i++) DATEN[i] = Wire.read();          // daten holen (zuerst busID, dann daten)
           // for (j = 0; j < busbytes; j++) Serial.println(DATEN[j]);        // daten an rs232 ausgeben   
          }            

//            Serial.println(Knotenadresse);
//            Serial.println(DATEN[0]);
//            Serial.println(DATEN[1]);
//            Serial.println(" ");
           
            adresse=DATEN[0]; 
            busstatus=DATEN[1];
           
            if(busstatus == 0)       {sensorbelegt=false;  ledsensoron=false;}
            else if (busstatus == 1) {sensorbelegt=false;  ledsensoron=true;}
            else if (busstatus == 2) {sensorbelegt=true;  ledsensoron=false;}
            else if (busstatus == 3) {sensorbelegt=true;  ledsensoron=true;}
      
         //################################################################################################
         //Testbutton Status lesen und variable testbut entsprechend setzen
       
          buttonState = digitalRead(buttonPin);               //tastereingang einlesen
          if(buttonState == HIGH){                            //wenn taster aktiv dann variable anim setzen
          anim = 1;
          //delay(5); 
          }
            
//            //debug debuginfo tasterstatus auf rs232 ausgeben
//            Serial.println("#######################");
//            Serial.print("Knoten Adresse    :");
//            Serial.println(adresse);
//            Serial.print("Busstatus         :");
//            Serial.println(busstatus);
//            
//            Serial.println("----------------");
//            Serial.print("Fliese belegt    :");
//            Serial.println(sensorbelegt);
//            Serial.print("LED Fliese       :");
//            Serial.println(ledsensoron);
//            Serial.print("#######################");
//            Serial.println(" ");
      
          //################################################################################################
          //Testbutton Status an jeweiligen knoten senden
      
          Wire.beginTransmission(Knotenadresse);           // transmit to device actual in for loop
          //anim schreiben
                    
           if (anim==0) {testbut=leddat1[j]; j++;}
                   else {testbut=leddat2[j]; j++;}
           if (j>8){j=0;}
          
          Wire.write(testbut);                             // senden des tasterstatus
          Wire.endTransmission();                          // ende gelände mit uerbertragung
       
          delay(DELAY);
          

    }
   
}


With this arrangement, it is now possible to read all Arduinos and their input or to control the LED via the bus. In the next step, a “sensor” is built, a board is laid out and the ArduinoUno reduced to its microcontroller. I’ll talk about that in one of the next posts …


Long-term measurements with Keithley and Matlab

Loading

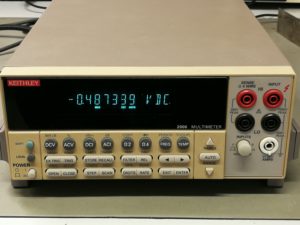
Keithley2000 desk multimeter

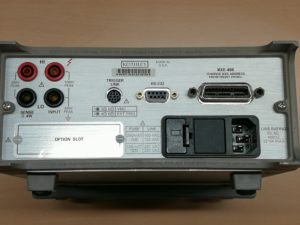
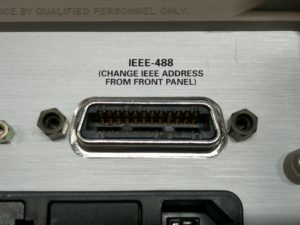
The bench multimeter from Keithley is an old companion in the field of measuring instruments. The types of the 2000 series are predominantly used in our laboratories. They are available in different equipment variants with regard to the interfaces to the outside world. Here GBIP bus is of course a standard, as is RS232. The newer devices now have a LAN interface with which communication via the Internet protocol is possible. Each of these interfaces can be used to communicate with the device using “Standard Commands for Programmable Instruments” (SCPI). In this example I will control the Keithley 2000 via Matlab and read out measured values ​​cyclically over a longer period of time, save them in Matlab and finally output them in a plot – virtually configure a simple data logger. The purpose of this setup is to record the voltage curve (or current) of a rechargeable battery or battery of a low-energy device.

backside of the Keithley 2000

GPIB Interface (IEEE488)

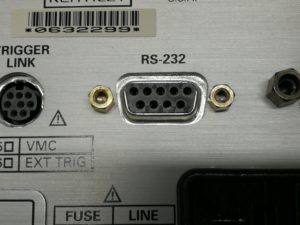
RS232 interface

In this example I will use the serial data transmission via the classic RS232 interface, as this is completely sufficient for my application. In addition, I can save myself the installation of the driver packages for the GPIP-USB interface. 🙂 Since many of the current computers and laptops no longer have any RS232 ports, a USB-RS232 adapter (e.g. FTDI232 etc.) is required.

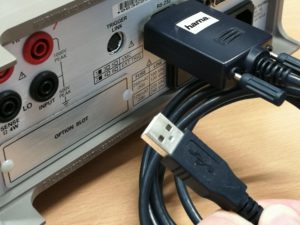
USB-RS232 Adaper am Keithley2000

Once the connection between the multimeter and the computer has been established, communication can take place via a Matlabscript, as in this example. The Keithley only needs to be told that it should “talk” over the serial interface. The following code snippets show how you can easily read out data via SCPI:


serialObject = instrfind('Type', 'serial', 'Port', 'COM26', 'Tag', '');
%serialPort = 'COM23';
%serialObject = serial(serialPort,'BaudRate',9600, 'DataBits',8);

if isempty(serialObject)
serialObject = serial('COM26','BaudRate',57600, 'DataBits',8);
else
fclose(serialObject);
serialObject = serialObject(1)
end

%%%%%%%%%%%%%%%%%%%%%%%%%%%%%%%%%%%%%%%%%%%%%%%%%%%%%%%
%
% Sourcemeter 2000 setup
%
%%%%%%%%%%%%%%%%%%%%%%%%%%%%%%%%%%%%%%%%%%%%%%%%%%%%%%
fopen(serialObject)
% fprintf(serialObject,':*RST')

time = now;
voltage = 0;
%%
figureinstanz = figure('NumberTitle','off',...
'Name','Spannungslogg',...
'Color',[0 0 0],'Visible','off');
plotinstanz = plot(voltage,time,'Color','red');

%% Messzeit und evtl Messintervall
stoptime = 10; %60 seconds
timeInterval = 1; % brauch' ma jetzt nicht

% Messgeraet einstellen
fprintf(serialObject,':SOUR:FUNC:MODE CURR'); % current source selection.
fprintf(serialObject,':SOUR:CURR:MODE FIXED'); % changes voltage mode to fixed
fprintf(serialObject,':SOUR:CURR:LEV 0'); % sets current to 0

fprintf(serialObject,':SENS:FUNC &quot;VOLT&quot;');
fprintf(serialObject,':SENS:VOLT:PROT 4');
%fprintf(serialObject,':SENS:CURR:RANG:AUTO ON');
fprintf(serialObject,':SENS:VOLT:RANG 10');
fprintf(serialObject,':FORM:ELEM VOLT');

% %fprintf(serialObject,':TRAC:COUN 1');
% %fprintf(serialObject,':TRAC:FEED:CONT NEV');
%
%
% fprintf(serialObject,':TRAC:CLE');
%
% fprintf(serialObject,':TRAC:POIN 10');
% fprintf(serialObject,'TRAC:FEED:SENS');
% fprintf(serialObject,'TRAC:FEED:CONT NECT');
% fprintf(serialObject,'TRIG:COUN 10');
% fprintf(serialObject,':OUTP ON');
%
% fprintf(serialObject,':INIT');
% fprintf(serialObject,':TRACE:DATA?');

%% Daten abholen
count = 1; voltage(1)=4
tic;
time=toc;
% while time&lt;=stoptime
while voltage&gt;=1.5
% fprintf(serialObject,':INIT');
% fprintf(serialObject,':TRAC:FEED SENS');
% fprintf(serialObject,':TRAC:DATA?');
%
fprintf(serialObject,':READ?');
voltage(count) = fscanf(serialObject,'%f');
time(count) = toc;
set(plotinstanz,'YData',voltage,'XData',time);
set(figureinstanz,'Visible','on');
pause(timeInterval);
count = count +1;
end

figure(1);
plot(time,voltage);
grid on; hold on;
xlabel('Zeit [s]'); ylabel('Batteriespannung [V]')
title('Spannungsverlauf Batterie 3V Lithium (2032 mit Modul) im default mode');

% fprintf(serialObject,':OUTP OFF');
%% Put the instrument in local mode
fprintf(serialObject,'SYSTEM:LOCAL');
fclose(serialObject);

The following plot shows what such a data log looks like. Here, the voltage curve of a nearly discharged battery is recorded over time until the consumer is switched off.

Read LCR meter via Matlab

Loading

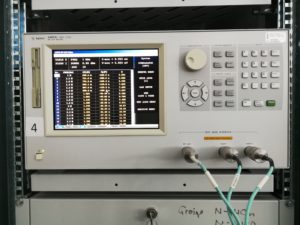
LCR-Meter 4297A Agilent

In this post I would like to devote myself to something else. It’s not about retro technology, it’s about a little thing that makes working in the office/lab easier. One of the many measuring devices I deal with is an old Agilent LCR meter. As is known, the LCR Meter 4297A can be used to measure the inductance, capacitance, etc. of electrical components and generally of structures which are assigned to the electronics / electrical engineering sector. Roughly speaking, the 4297A actually only measures current / voltage, the phase relationship between the two and the energy direction. And at a certain frequency. All parameters such as L, C, R, X, Y, Q, PHI, … are then mathematically calculated and output from these parameters. The frequency here can be set from 1MHz to 3GHz (in 100kHz steps). Ideally, the measuring device can measure not only in one frequency point, but also in many. By “many” is meant here that the measuring device can generate frequency tables with 32 entries. There are eight of these tables. This makes it possible to display the course of a measured variable in the form of a curve. However, this is quite cumbersome. The contents of the tables must be exported and saved manually (as “csv” files) table by table. This means that each table must be selected individually. Then select the “Export List View” dialog – then specify a storage path and file name. Only now are the first 32 records exported. This process must be repeated eight times in total. It is saved on a 3.5 inch floppy disc – the only available medium. You could also hang the 4297A optiona on a LAN and set up file sharing. However, manual export is not spared. The .csv files can now be opened on a “normal” computer. They must then be put together manually in postprocessing. Only now can a diagram be made from the data. Here Matlab from Matworks is a good tool, which is often used in our laboratories as part of training.

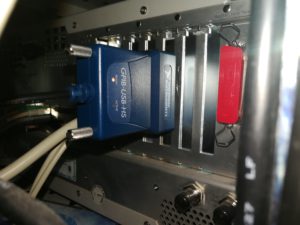
NI GPIB – USB Controller

To simplify this cumbersome process considerably, I created a small script that communicates with the measuring device using the SCPI commands (Standard Commands for Programmable Instruments). That means: The measuring device is connected to a PC via a GPIB-USB controller. A Matworks Matlab installation including the required toolboxes is located on the PC. The Matlab script should now simply switch through the tables in sequence and read out the contents of the individual parameters and save them in an array. The content of the arrays is then displayed directly in a plot. However, this method only uses the contents of the tables. It would of course also be possible to set any desired frequency directly in a loop using the script, read out the measured values, select the next frequency, etc. This would max. Total 29990 points over the entire frequency range. The eight tables, each with 32 points, only allow 256 points. For now, however, that is sufficient and also much faster.

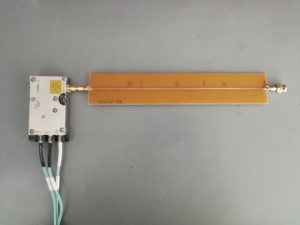
Transmission Line 50 Ohm termination resistor

line is terminated

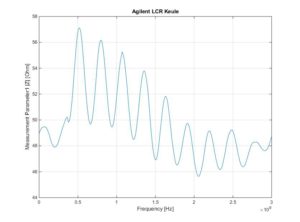
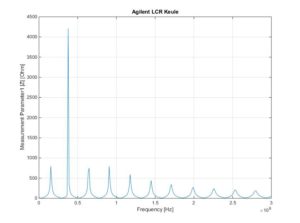
The example shows the impedance curve (Z curve) of a 50 Ohm transmission line. The end of the line is terminated with a 50 ohm resistor. The frequency range is 1MHz to 3 GHz. The situation is different if the line is open or closed briefly. The electromagnetic wave is then not converted into thermal energy at the end of the line, as in the “matched” system, but is reflected back into the system.

line is shortened

The following very simple Matlabscript enables the reading of the measuring device parameters. The script serves as an example of how to get the measurement data quickly. The programming manual of the manufacturer of the LCR meter lists all SCPI commandos and plenty of examples with which you can communicate with the measuring device.


%auslesen der agilent LCR Keule 4287A
%gekodet von ingmar bihlo Ende November 2017

%anschluss über gpib ni adapter
%LCR gpip adresse: 5
%%
%vorarbeiten an LCR Keule
%
% Es müssen 8 Tabellen mit je 32 Punkten definiert sein
% (power und average ist egal, wird nicht ausgelesen)
% die CALibration muss gemacht worden sein
% unter &quot;measurement parameters&quot; muessen vier parameter definiert sein
% zb. Z, qhi, R, L, etc... diese sind dann in den variablen param1 bis 4
% enthalten

%%

% gpib interface oeffnen und identifier lesen
g = gpib('ni', 0, 5);
g.InputBufferSize = 100000; % Set the buffer size
fopen(g);
fprintf(g, '*IDN?')
idn = fscanf(g);
fclose(g);

num1all=0; % initialisieren der variablen für den summenvector
num2all=0;
num3all=0;
num4all=0;
freq=0;

fopen(g);
%read list parameters (frequency points)
fprintf(g, ':SOUR:LIST?');
fpoint=fscanf(g);
listchar=strsplit(fpoint,',');
list=[cellfun(@str2num, listchar(:,1:end))]
clear listchat; clear fpoint;

%analyze list content
points=freq(1);

for i=1:8
%Tables selecten
fprintf(g, strcat(':SOUR:LIST:TABL 0',num2str(i)));
pause(1); %pause 1s zum umschalten der tabelle

%parameter1 abholen
fprintf(g, ':DATA:FDAT1?'); %parameter 1 anfragen
par1=fscanf(g); %parameter 1 holen

string1=strsplit(par1,','); %parameter 1 string nach komma zerlegen
%num1=[cellfun(@str2num, string1(:,1:end))] %parameter 1 strings in dec konvertieren
num1=[cellfun(@str2num, string1(:,1:end))];
num1all=[num1all,num1]; %parameter1 aktuell mit parameter1 aus vorherigem durchlauf concentenaten

fprintf(g, ':DATA:FDAT2?');
par2=fscanf(g);
string2=strsplit(par2,',');
num2=[cellfun(@str2num, string2(:,1:end))]
num2all=[num2all,num2];

fprintf(g, ':DATA:FDAT3?');
par3=fscanf(g);
string3=strsplit(par3,',');
num3=[cellfun(@str2num, string3(:,1:end))]
num3all=[num3all,num3];

fprintf(g, ':DATA:FDAT4?');
par4=fscanf(g);
string4=strsplit(par4,',');
num4=[cellfun(@str2num, string4(:,1:end))]
num4all=[num4all,num4];

%read list parameters (frequency points)
fprintf(g, ':SOUR:LIST?');
fpoint=fscanf(g);
listchar=strsplit(fpoint,',');
listraw=[cellfun(@str2num, listchar(:,1:end))];
list=listraw(:,2:end); %von pos2 das feld schreiben (an pos ist die anzahl der zeilen)

for c=1:3:96
freq=[freq,list(c)]; %von jedem 3. wert aus list ein neues array bilden
end

clear listchat; clear fpoint;

pause (1);
end

%%

%ausgabevariablen festlegen
frequency=freq(:,2:end);
param1=num1all(:,2:end);
param2=num2all(:,2:end);
param3=num3all(:,2:end);
param4=num4all(:,2:end);

%%
% Cell array richtig uma drahn
x1=param1(1:32);
y1=param1(33:256);
param1 = [y1 x1];

x2=param2(1:32);
y2=param2(33:256);
param2 = [y2 x2];

x3=param3(1:32);
y3=param3(33:256);
param3 = [y3 x3];

x4=param4(1:32);
y4=param4(33:256);
param4 = [y4 x4];
%%
%uerberflüssige variablen loeschen
clear c; clear i; clear list; %clear freq;
clear par1;clear par2;clear par3;clear par4;
clear string1;clear string2;clear string3;clear string4;
clear num1all;clear num2all;clear num3all;clear num4all;

fclose(g);

%plotten der ergebnisse
figure(1);
plot(frequency,param1);
grid on; hold on;
xlabel('Frequency [Hz]'); ylabel('Measurement Parameter1 |Z| [Ohm]');
title('Agilent LCR Keule');

figure(2);
plot(frequency,param2);
grid on; hold on;
xlabel('Frequency'); ylabel('Measurement Parameter2');
title('Agilent LCR Keule');

figure(3);
plot(frequency,param3);
grid on; hold on;
xlabel('Frequency'); ylabel('Measurement Parameter3');
title('Agilent LCR Keule');

figure(4);
plot(frequency,param4);
grid on; hold on;
xlabel('Frequency'); ylabel('Measurement Parameter4');
title('Agilent LCR Keule');