![]()
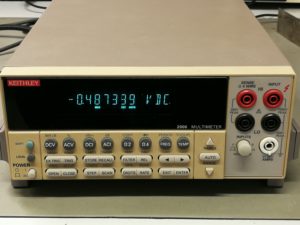
The bench multimeter from Keithley is an old companion in the field of measuring instruments. The types of the 2000 series are predominantly used in our laboratories. They are available in different equipment variants with regard to the interfaces to the outside world. Here GBIP bus is of course a standard, as is RS232. The newer devices now have a LAN interface with which communication via the Internet protocol is possible. Each of these interfaces can be used to communicate with the device using “Standard Commands for Programmable Instruments” (SCPI). In this example I will control the Keithley 2000 via Matlab and read out measured values cyclically over a longer period of time, save them in Matlab and finally output them in a plot – virtually configure a simple data logger. The purpose of this setup is to record the voltage curve (or current) of a rechargeable battery or battery of a low-energy device.
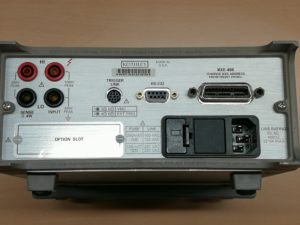
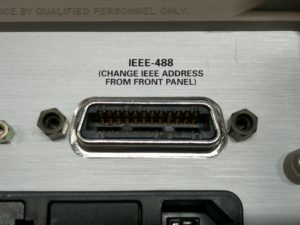
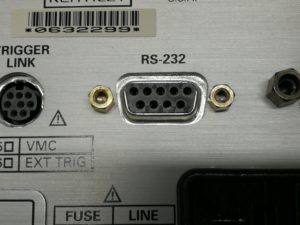
In this example I will use the serial data transmission via the classic RS232 interface, as this is completely sufficient for my application. In addition, I can save myself the installation of the driver packages for the GPIP-USB interface. 🙂 Since many of the current computers and laptops no longer have any RS232 ports, a USB-RS232 adapter (e.g. FTDI232 etc.) is required.
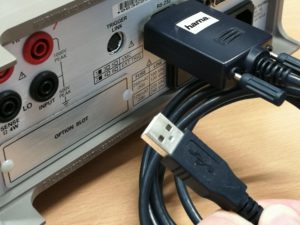
Once the connection between the multimeter and the computer has been established, communication can take place via a Matlabscript, as in this example. The Keithley only needs to be told that it should “talk” over the serial interface. The following code snippets show how you can easily read out data via SCPI:
serialObject = instrfind('Type', 'serial', 'Port', 'COM26', 'Tag', '');
%serialPort = 'COM23';
%serialObject = serial(serialPort,'BaudRate',9600, 'DataBits',8);

if isempty(serialObject)
serialObject = serial('COM26','BaudRate',57600, 'DataBits',8);
else
fclose(serialObject);
serialObject = serialObject(1)
end

%%%%%%%%%%%%%%%%%%%%%%%%%%%%%%%%%%%%%%%%%%%%%%%%%%%%%%%
%
% Sourcemeter 2000 setup
%
%%%%%%%%%%%%%%%%%%%%%%%%%%%%%%%%%%%%%%%%%%%%%%%%%%%%%%
fopen(serialObject)
% fprintf(serialObject,':*RST')

time = now;
voltage = 0;
%%
figureinstanz = figure('NumberTitle','off',...
'Name','Spannungslogg',...
'Color',[0 0 0],'Visible','off');
plotinstanz = plot(voltage,time,'Color','red');

%% Messzeit und evtl Messintervall
stoptime = 10; %60 seconds
timeInterval = 1; % brauch' ma jetzt nicht

% Messgeraet einstellen
fprintf(serialObject,':SOUR:FUNC:MODE CURR'); % current source selection.
fprintf(serialObject,':SOUR:CURR:MODE FIXED'); % changes voltage mode to fixed
fprintf(serialObject,':SOUR:CURR:LEV 0'); % sets current to 0

fprintf(serialObject,':SENS:FUNC "VOLT"');
fprintf(serialObject,':SENS:VOLT:PROT 4');
%fprintf(serialObject,':SENS:CURR:RANG:AUTO ON');
fprintf(serialObject,':SENS:VOLT:RANG 10');
fprintf(serialObject,':FORM:ELEM VOLT');

% %fprintf(serialObject,':TRAC:COUN 1');
% %fprintf(serialObject,':TRAC:FEED:CONT NEV');
%
%
% fprintf(serialObject,':TRAC:CLE');
%
% fprintf(serialObject,':TRAC:POIN 10');
% fprintf(serialObject,'TRAC:FEED:SENS');
% fprintf(serialObject,'TRAC:FEED:CONT NECT');
% fprintf(serialObject,'TRIG:COUN 10');
% fprintf(serialObject,':OUTP ON');
%
% fprintf(serialObject,':INIT');
% fprintf(serialObject,':TRACE:DATA?');

%% Daten abholen
count = 1; voltage(1)=4
tic;
time=toc;
% while time<=stoptime
while voltage>=1.5
% fprintf(serialObject,':INIT');
% fprintf(serialObject,':TRAC:FEED SENS');
% fprintf(serialObject,':TRAC:DATA?');
%
fprintf(serialObject,':READ?');
voltage(count) = fscanf(serialObject,'%f');
time(count) = toc;
set(plotinstanz,'YData',voltage,'XData',time);
set(figureinstanz,'Visible','on');
pause(timeInterval);
count = count +1;
end

figure(1);
plot(time,voltage);
grid on; hold on;
xlabel('Zeit [s]'); ylabel('Batteriespannung [V]')
title('Spannungsverlauf Batterie 3V Lithium (2032 mit Modul) im default mode');

% fprintf(serialObject,':OUTP OFF');
%% Put the instrument in local mode
fprintf(serialObject,'SYSTEM:LOCAL');
fclose(serialObject);
The following plot shows what such a data log looks like. Here, the voltage curve of a nearly discharged battery is recorded over time until the consumer is switched off.
