
UV sensor logger self-made
![]()
When summer comes, new ideas come. In the summer months, as is well known, the duration of sunshine is longer and the intensity of the sun’s rays is higher. Many use this property of the sun to boost their body’s vitamin D production, while others lie under the source of radiation to darken their skin color due to the high UV component. This, in turn, supposedly increases their attractiveness and stimulates hormone production and the willingness to mate… Unfortunately, the non-visible UV range in the spectrum of sunlight is known to have negative effects on the human body. Sunlight can also be used technically. On average, the power of the sun per unit area is assumed to be 1000W per m². Large-area P-N junctions in semiconductor materials are now able to generate electrical energy with an efficiency of up to aprox. 22%.
But the energy can also be used in other ways, or the UV component. Many retro collectors are certainly aware of the problem with yellowed old plastic cases. In order to get this under control, or to get it back to its original state from 30 or 40 years ago, you use H2O2, i.e. hydrogen peroxide and UV light, to get a bleaching process going. And so I came up with the idea for the following project.
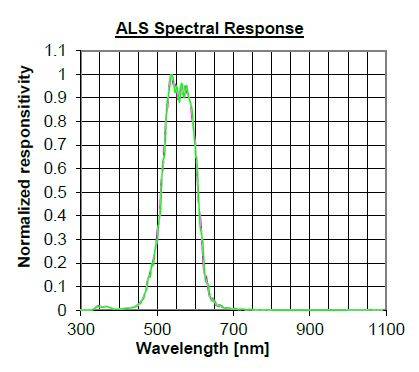
At an online electronics store I found a UV sensor board from the manufacturer Waveshare in the sale. On it is a LITEON OPTOELECTRONICS LTR390 chip including a level shifter circuit. An I²C bus is available as an interface. A look at the data sheet revealed to me that the sensor records two wavelength ranges and outputs them separately. The ALS (Ambient Light Sensor from 500-600nm) and the UV (Ultra Violet range from 300-350nm). You can quickly make a simple logging board with this – I thought to myself. So I figured the board should be able to do the following:
- Powered by a 18650 cell or USB
- USB should also be able to charge the battery
- a micro SD slot for recording the sensor data
- an RS-232 port for direct logging on the PC
- a cool OLED display
- two buttons to operate the logger (interval, start/stop etc.)
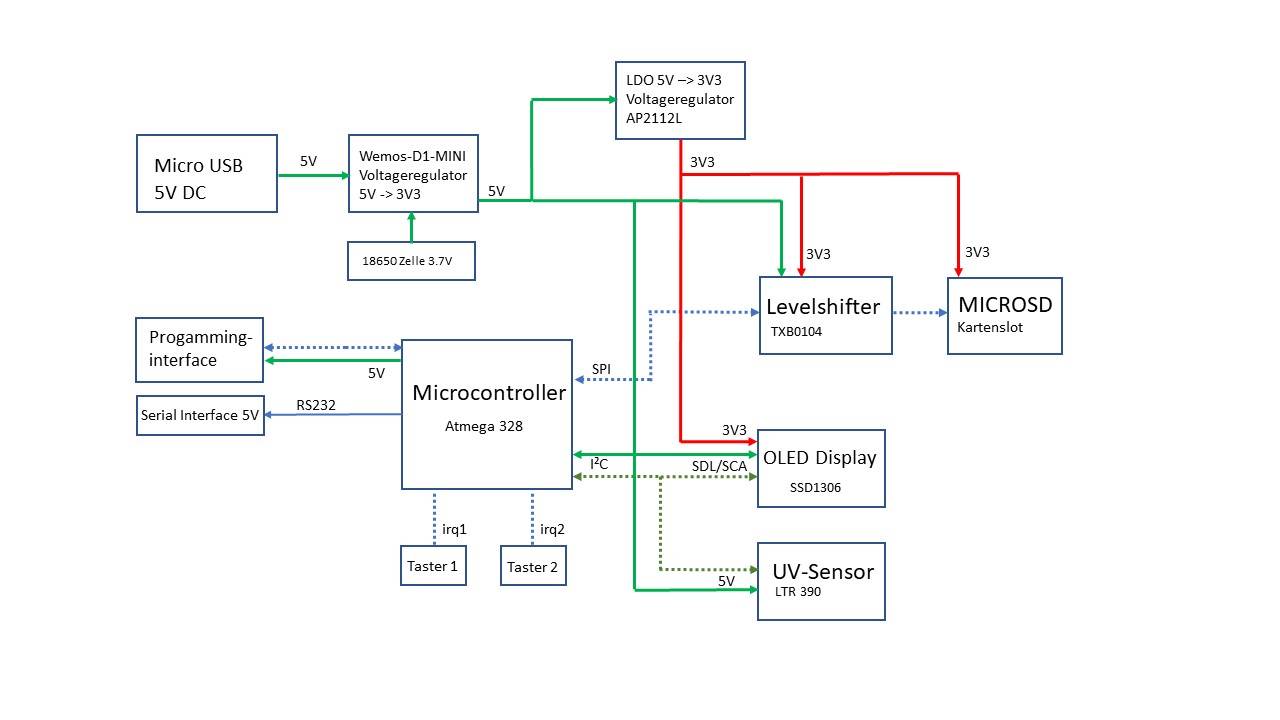
The control should of course once again take over a chip from Atmega – the 328er. There are just enough of these in my assortment of boxes. To give you a quicker overview of the structure, I drew the following block diagram:
In the next step I created a circuit diagram from the block diagram in order to be able to create a layout out of it. Parallel to the creation of the circuit diagram, I also connected the single components together as a test using “air cabling” and tested whether everything worked as I imagined. And above all, everything should have space in the flash memory of the microcontroller.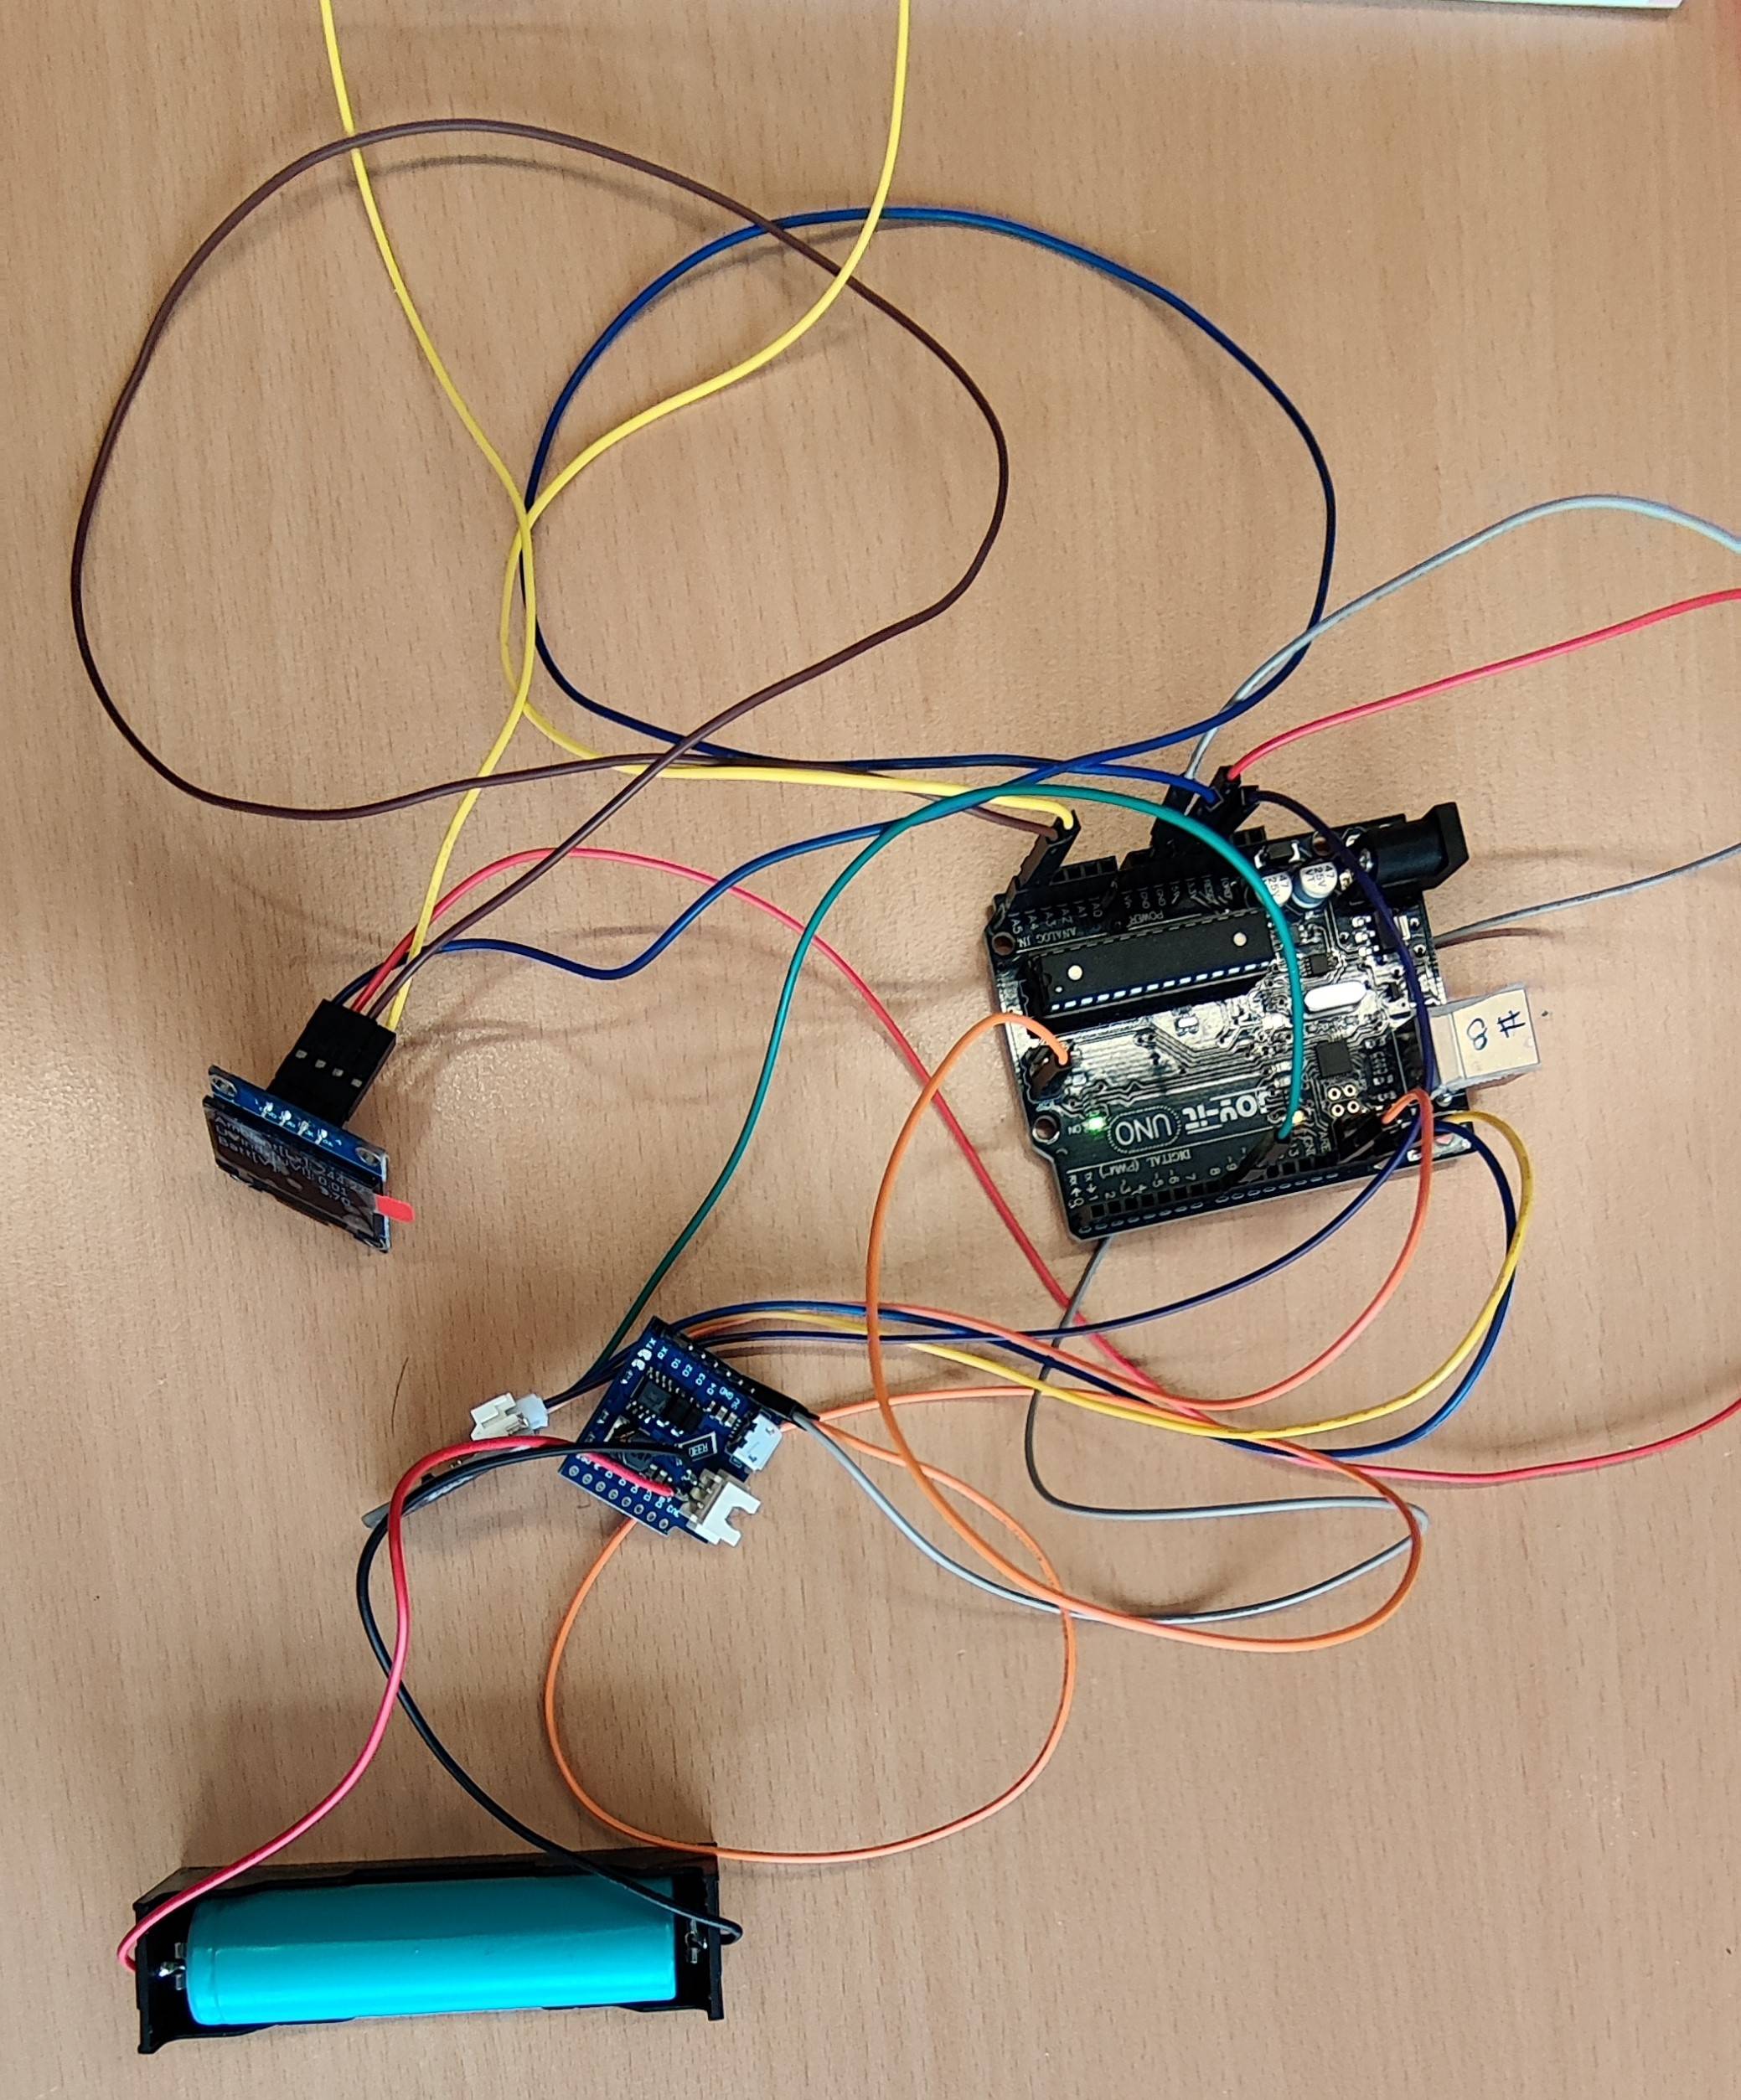
The “airy wired” structure consisting of finished components can be seen in the picture above. An Arduino was sufficient for the first tests with the sensor and the OLED display. This enabled me to test the desired functions. So nothing stood in the way of creating the circuit diagram. An 18650 lithium cell will serve as the primary power source. Alternatively, there will also be a USB port that can charge the cell or operate the sensor. Because I’m lazy and component delivery bottlenecks are also a big problem at the moment, I use a ready-made Wemos D1 mini board to charge the battery. Like the OLED display board and the sensor board, this will find its place as a finished component on the circuit board design. As already mentioned, an Atmega328 in a TQFP housing is used as the controller. This will communicate with the OLED display (SBC-OLED01 with SSD1306 controller) and the LTR390 UV sensor board via the I²C interface. OLED and sensor are 5V compatible. However, the SD card is operated with 3.3V. For this, the circuit requires a voltage converter from 5V to 3.3V for the supply and a level shifter for the SPI data bus, via which the SD card exchanges data with the Atmega. Since the Atmega then also wants to be programmed with its firmware, I have provided a 2×4 pin header for connecting a programmer. The programmer needs six of these pins (GND,5V, MOSI, MISO, SCK and RESET) and the two remaining pins are intended for the serial interface. The two interrupt inputs of the Atmega are each wired with a button, which then makes the software operable. The battery voltage is measured and logged via a divider at one of the ADC inputs. The result of these thoughts is the following schematic:
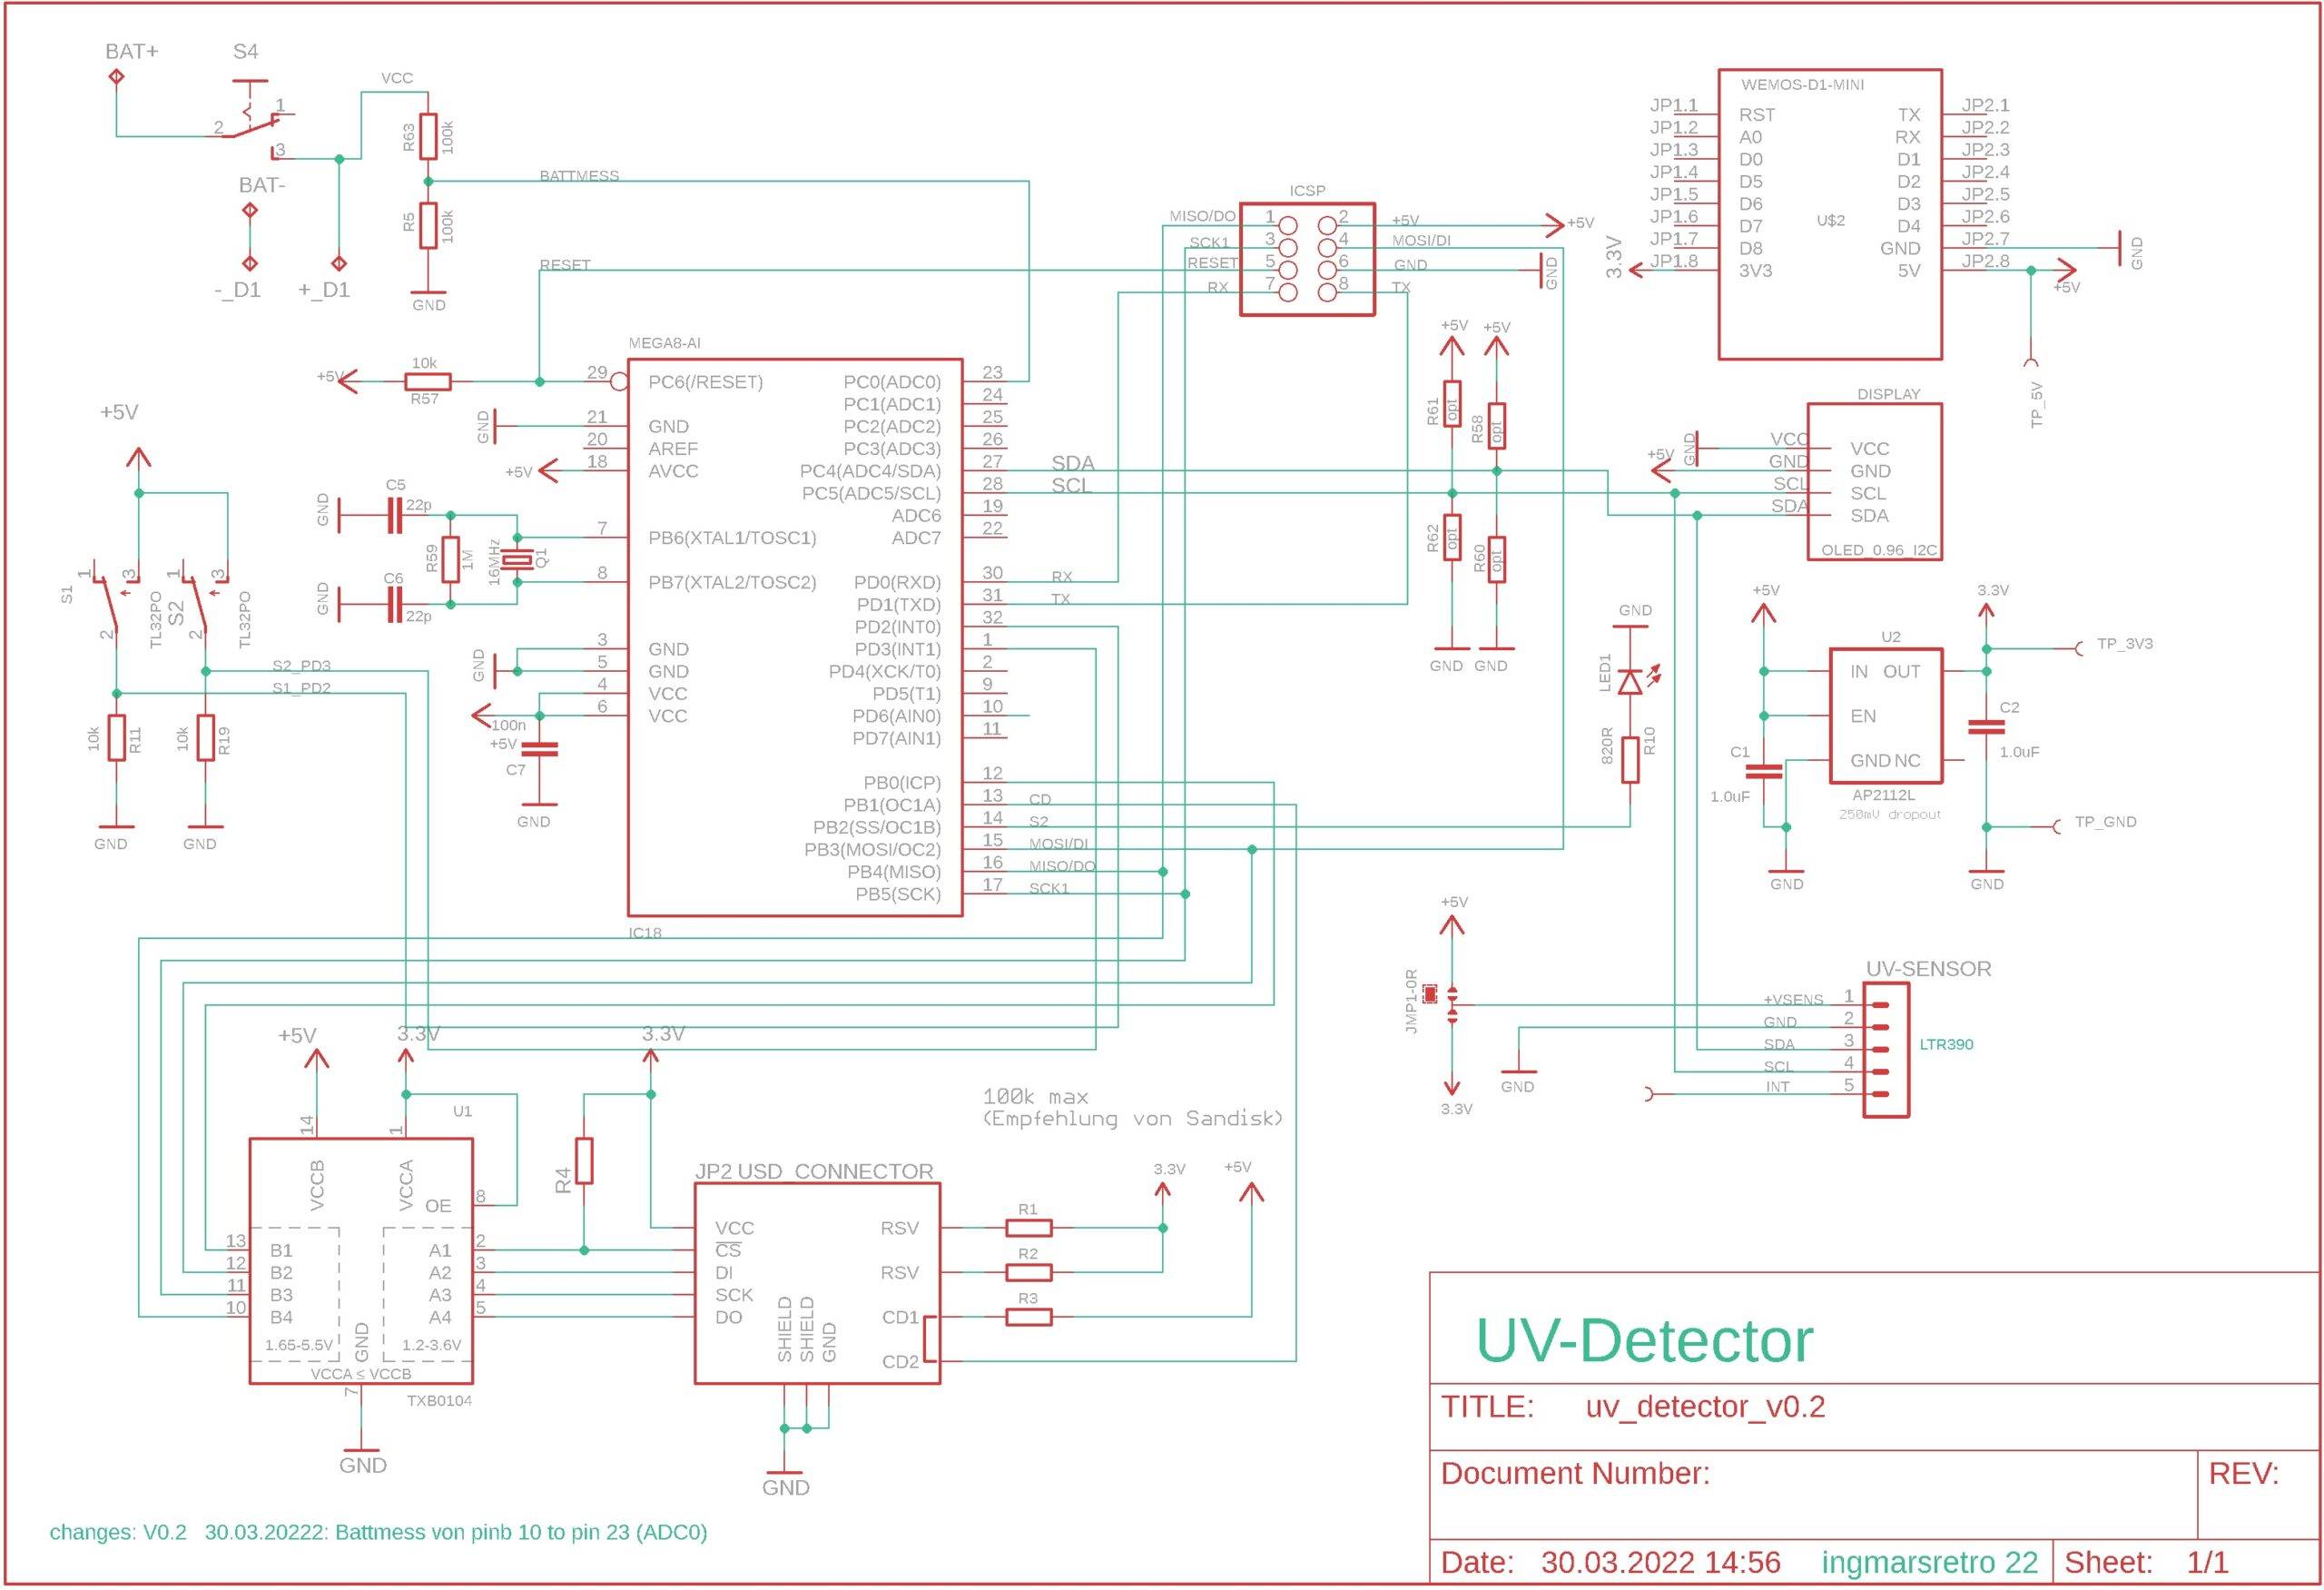
A layout is then the next step. With a size of 12 x 4.5 cm, the circuit board is reasonably “handy”. The printed conductors are routed on both sides and the modules (charging circuit, display and UV sensor) are designed to be pluggable via pin headers.

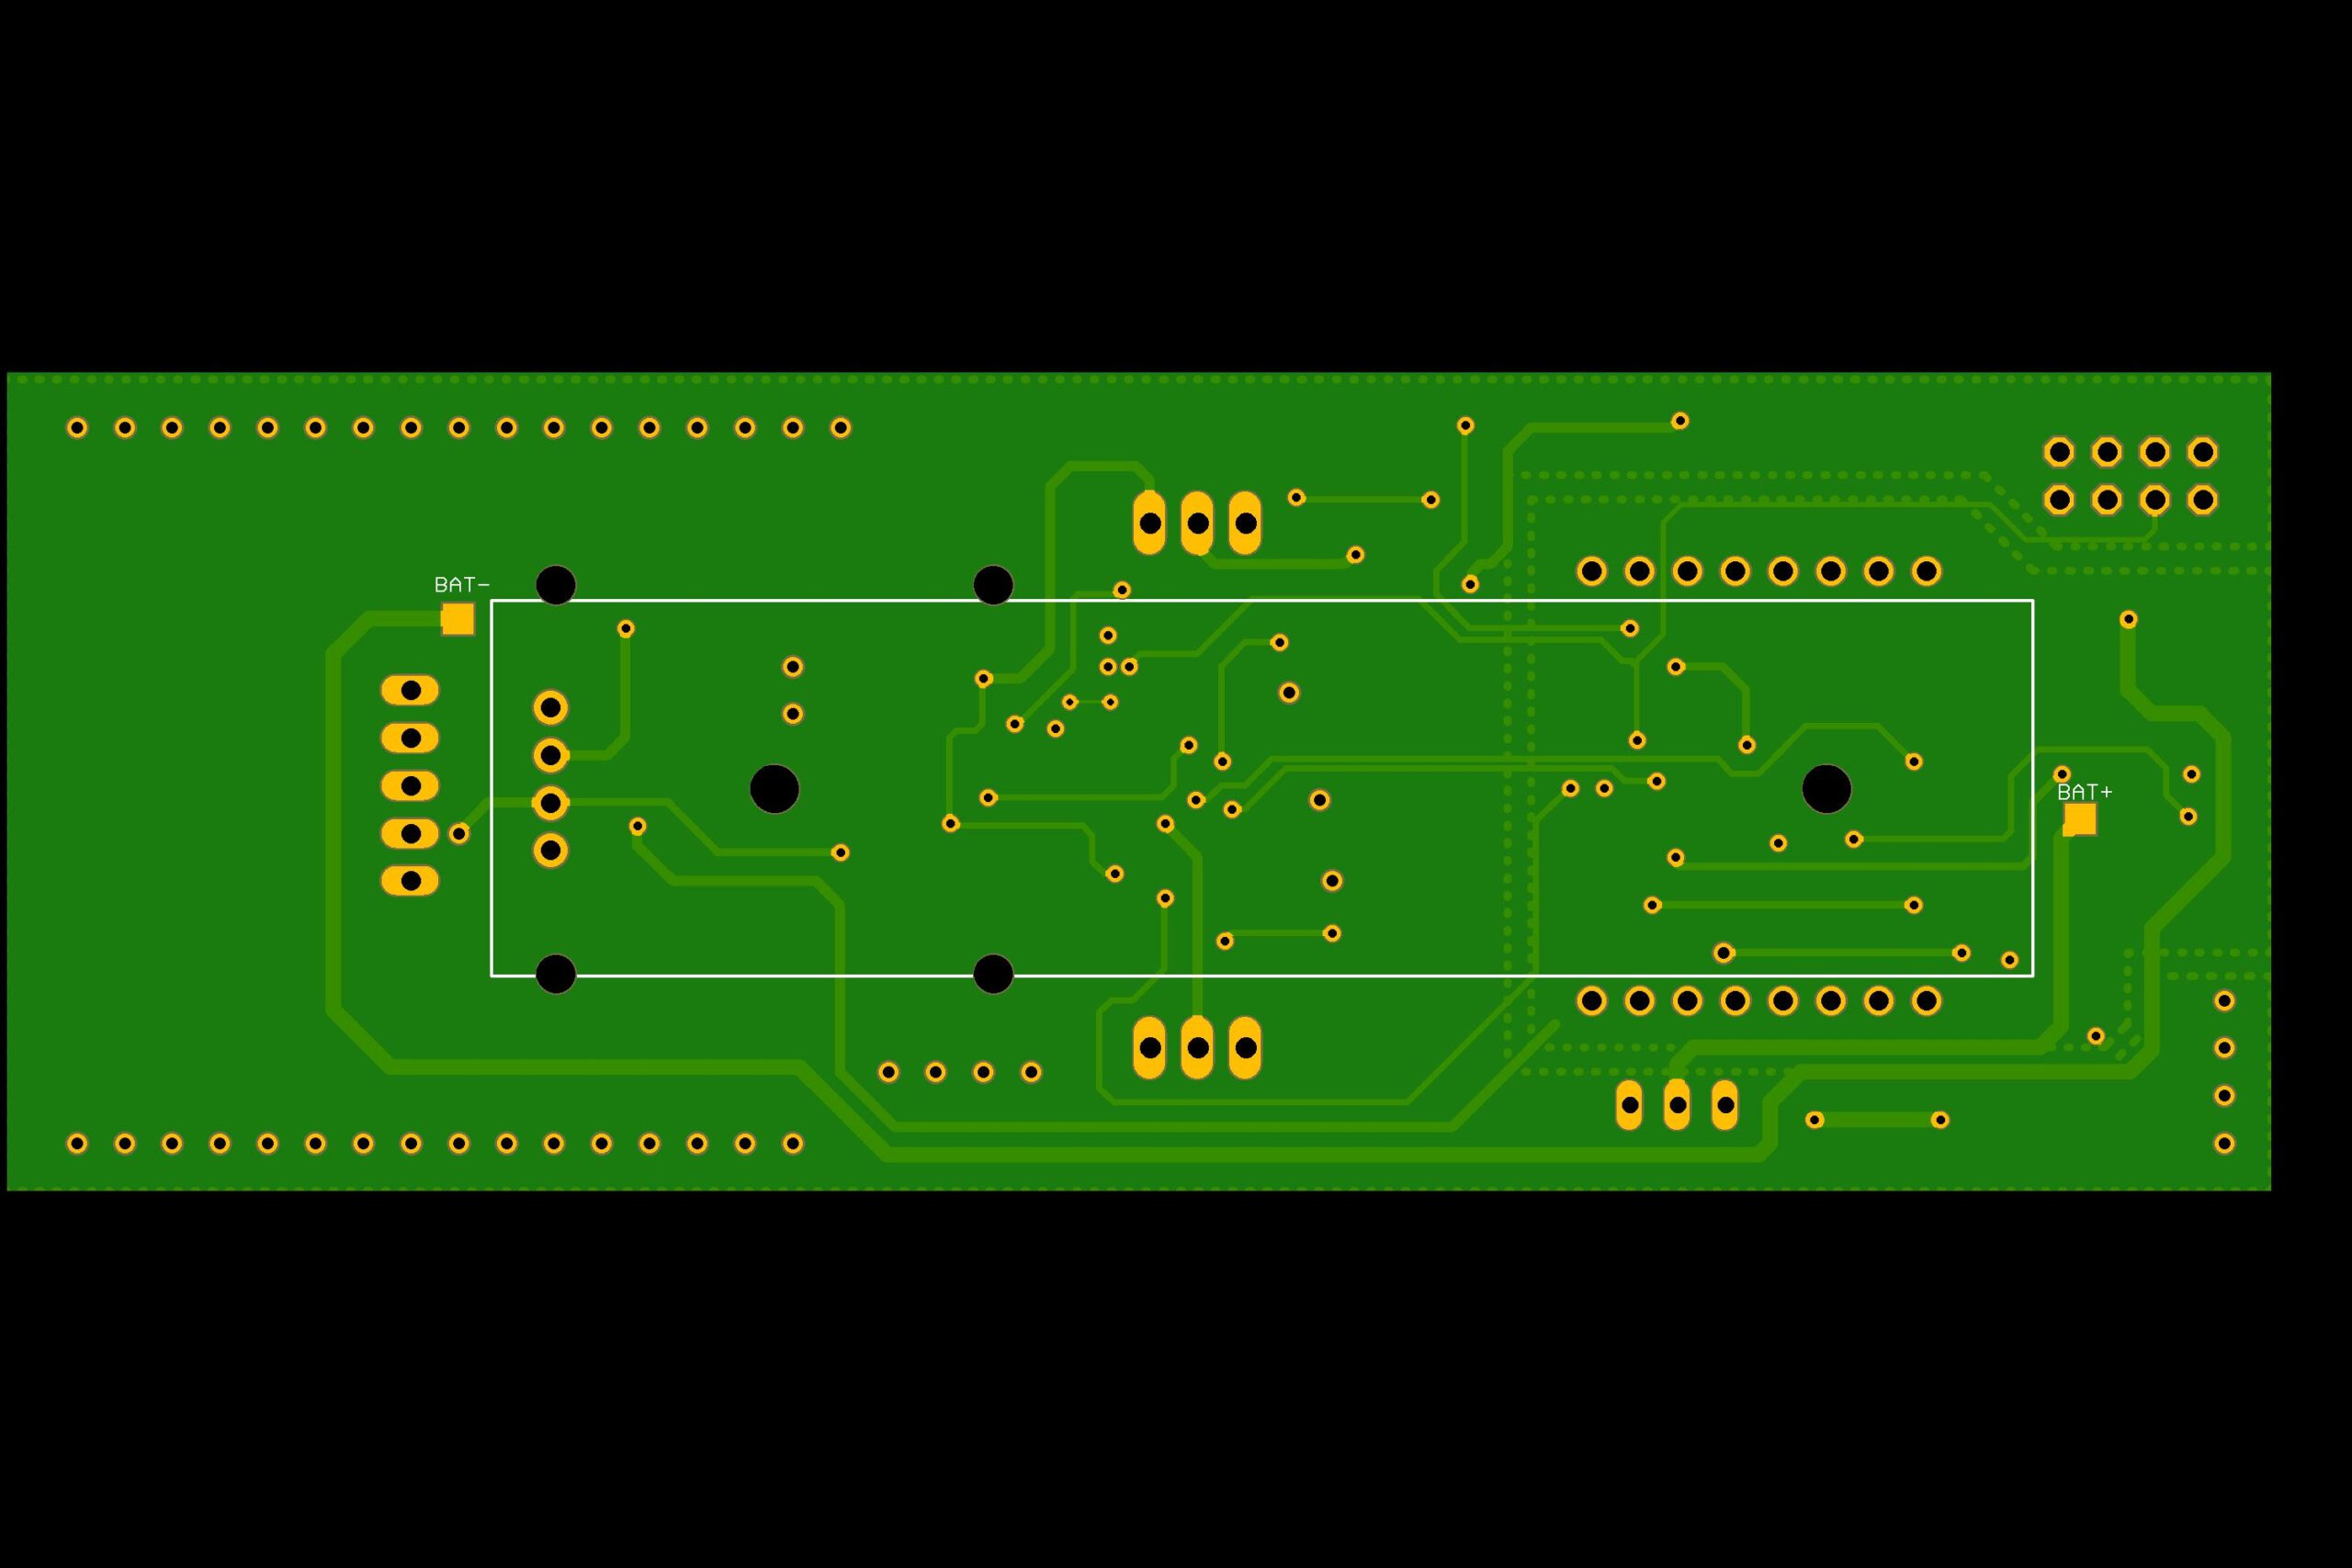
The two images above show the preview of the “Top” and “Bottom” side of the layout. A circuit board could be created from the production data created in this way.
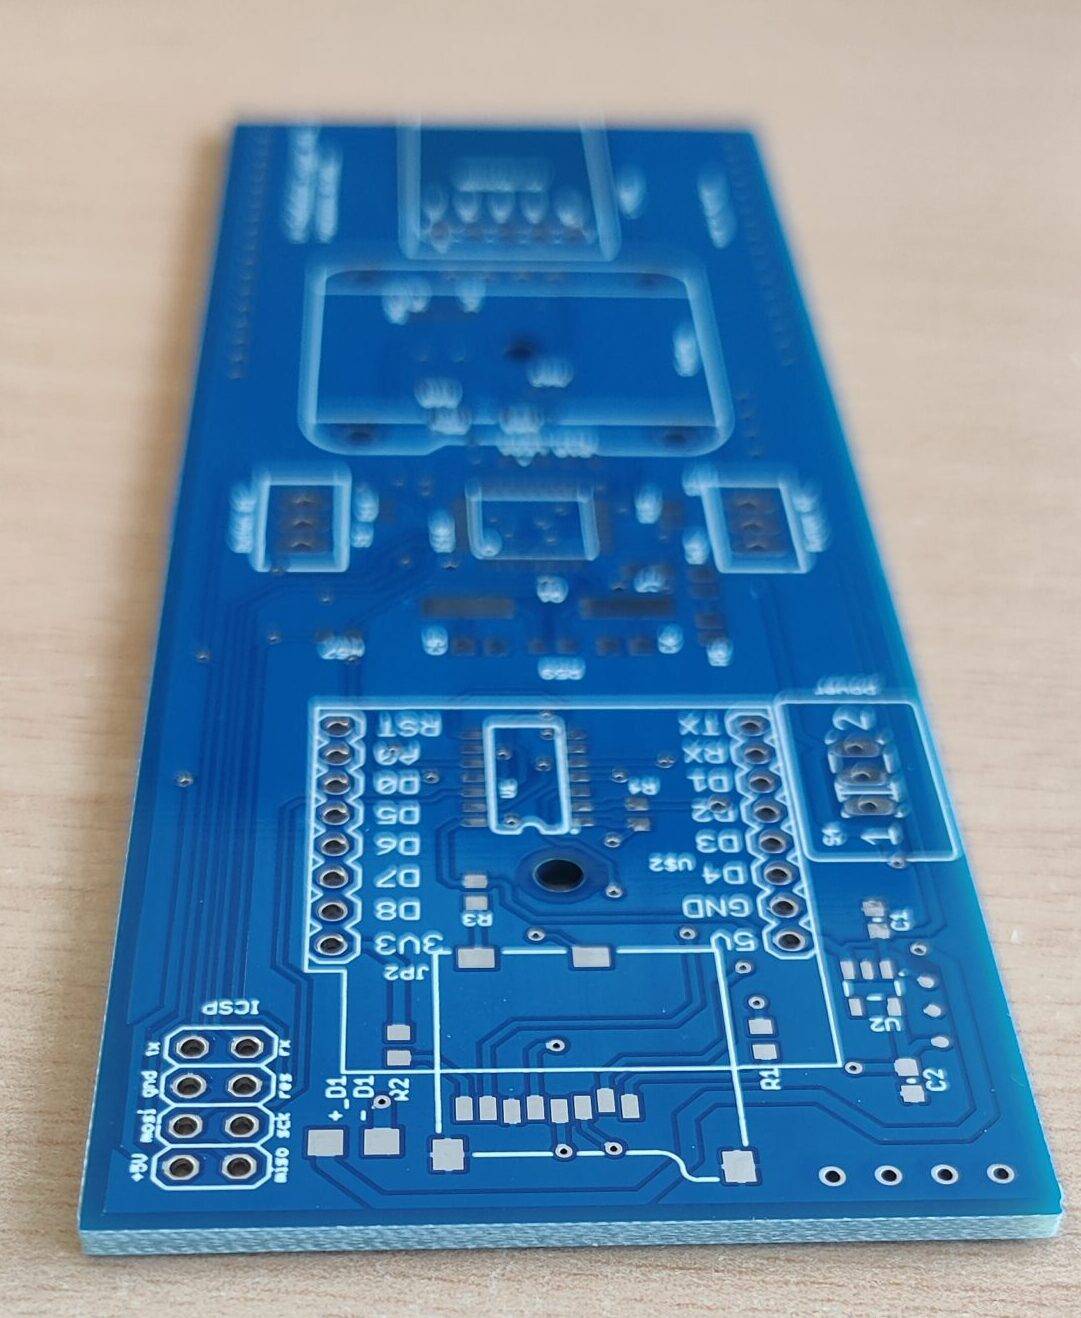
After some soldering work the hardware was ready. In order to breathe life into this “soldering” , software was required to do its work on the microcontroller.
When tinkering with the software, I used the free “Arduino IDE” development environment. The LTR390 documentation describes exactly which registers are used to operate which sensor functions. But there is also a ready-made library for those who are very comfortable – just like for almost all sensors and actuators that are to be connected to microcontrollers. In the Arduino IDE you can find the “Adafruit LTR390 Library” via the board manager, which you can use to communicate easily with the sensor. In my case, the OLED display is controlled by the SSD1306Ascii library. The “Wire” and “SPI” library take over the bus communication and the “SD” talks to the SD card. The includes then look like this:
#include <LTR390.h>
#include <SD.h>
#include <SPI.h>
#include <Wire.h>
#include “SSD1306Ascii.h”
#include “SSD1306AsciiWire.h”
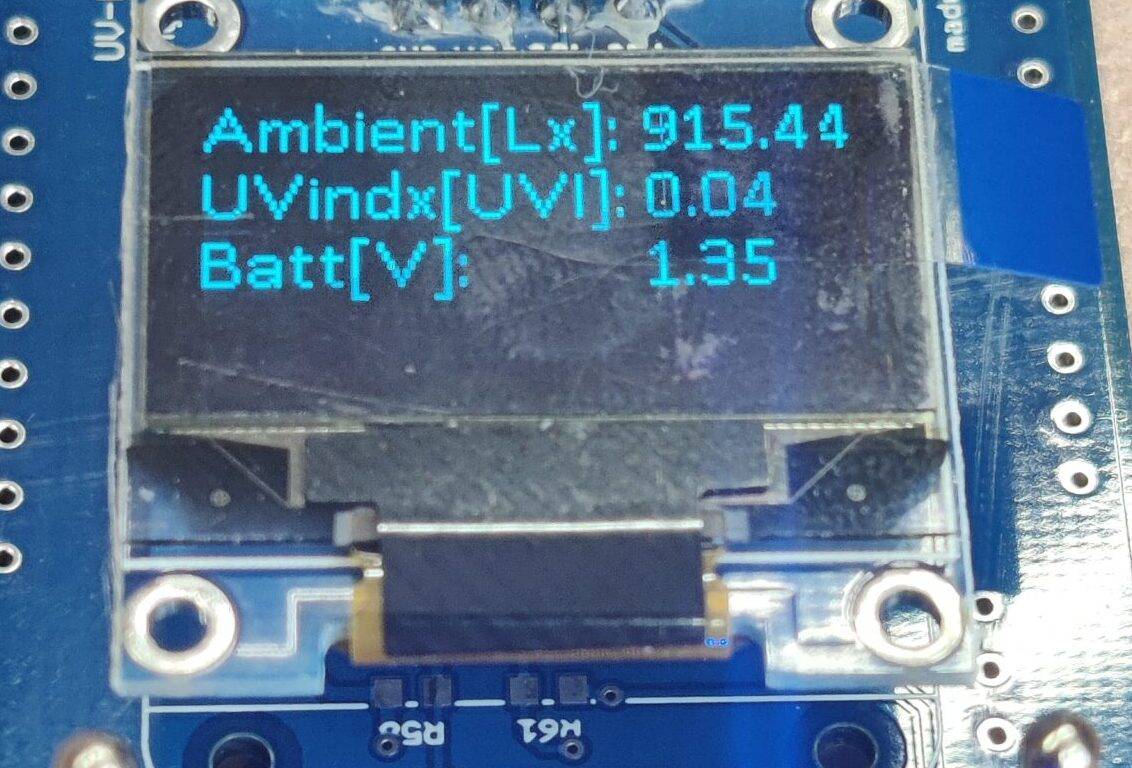
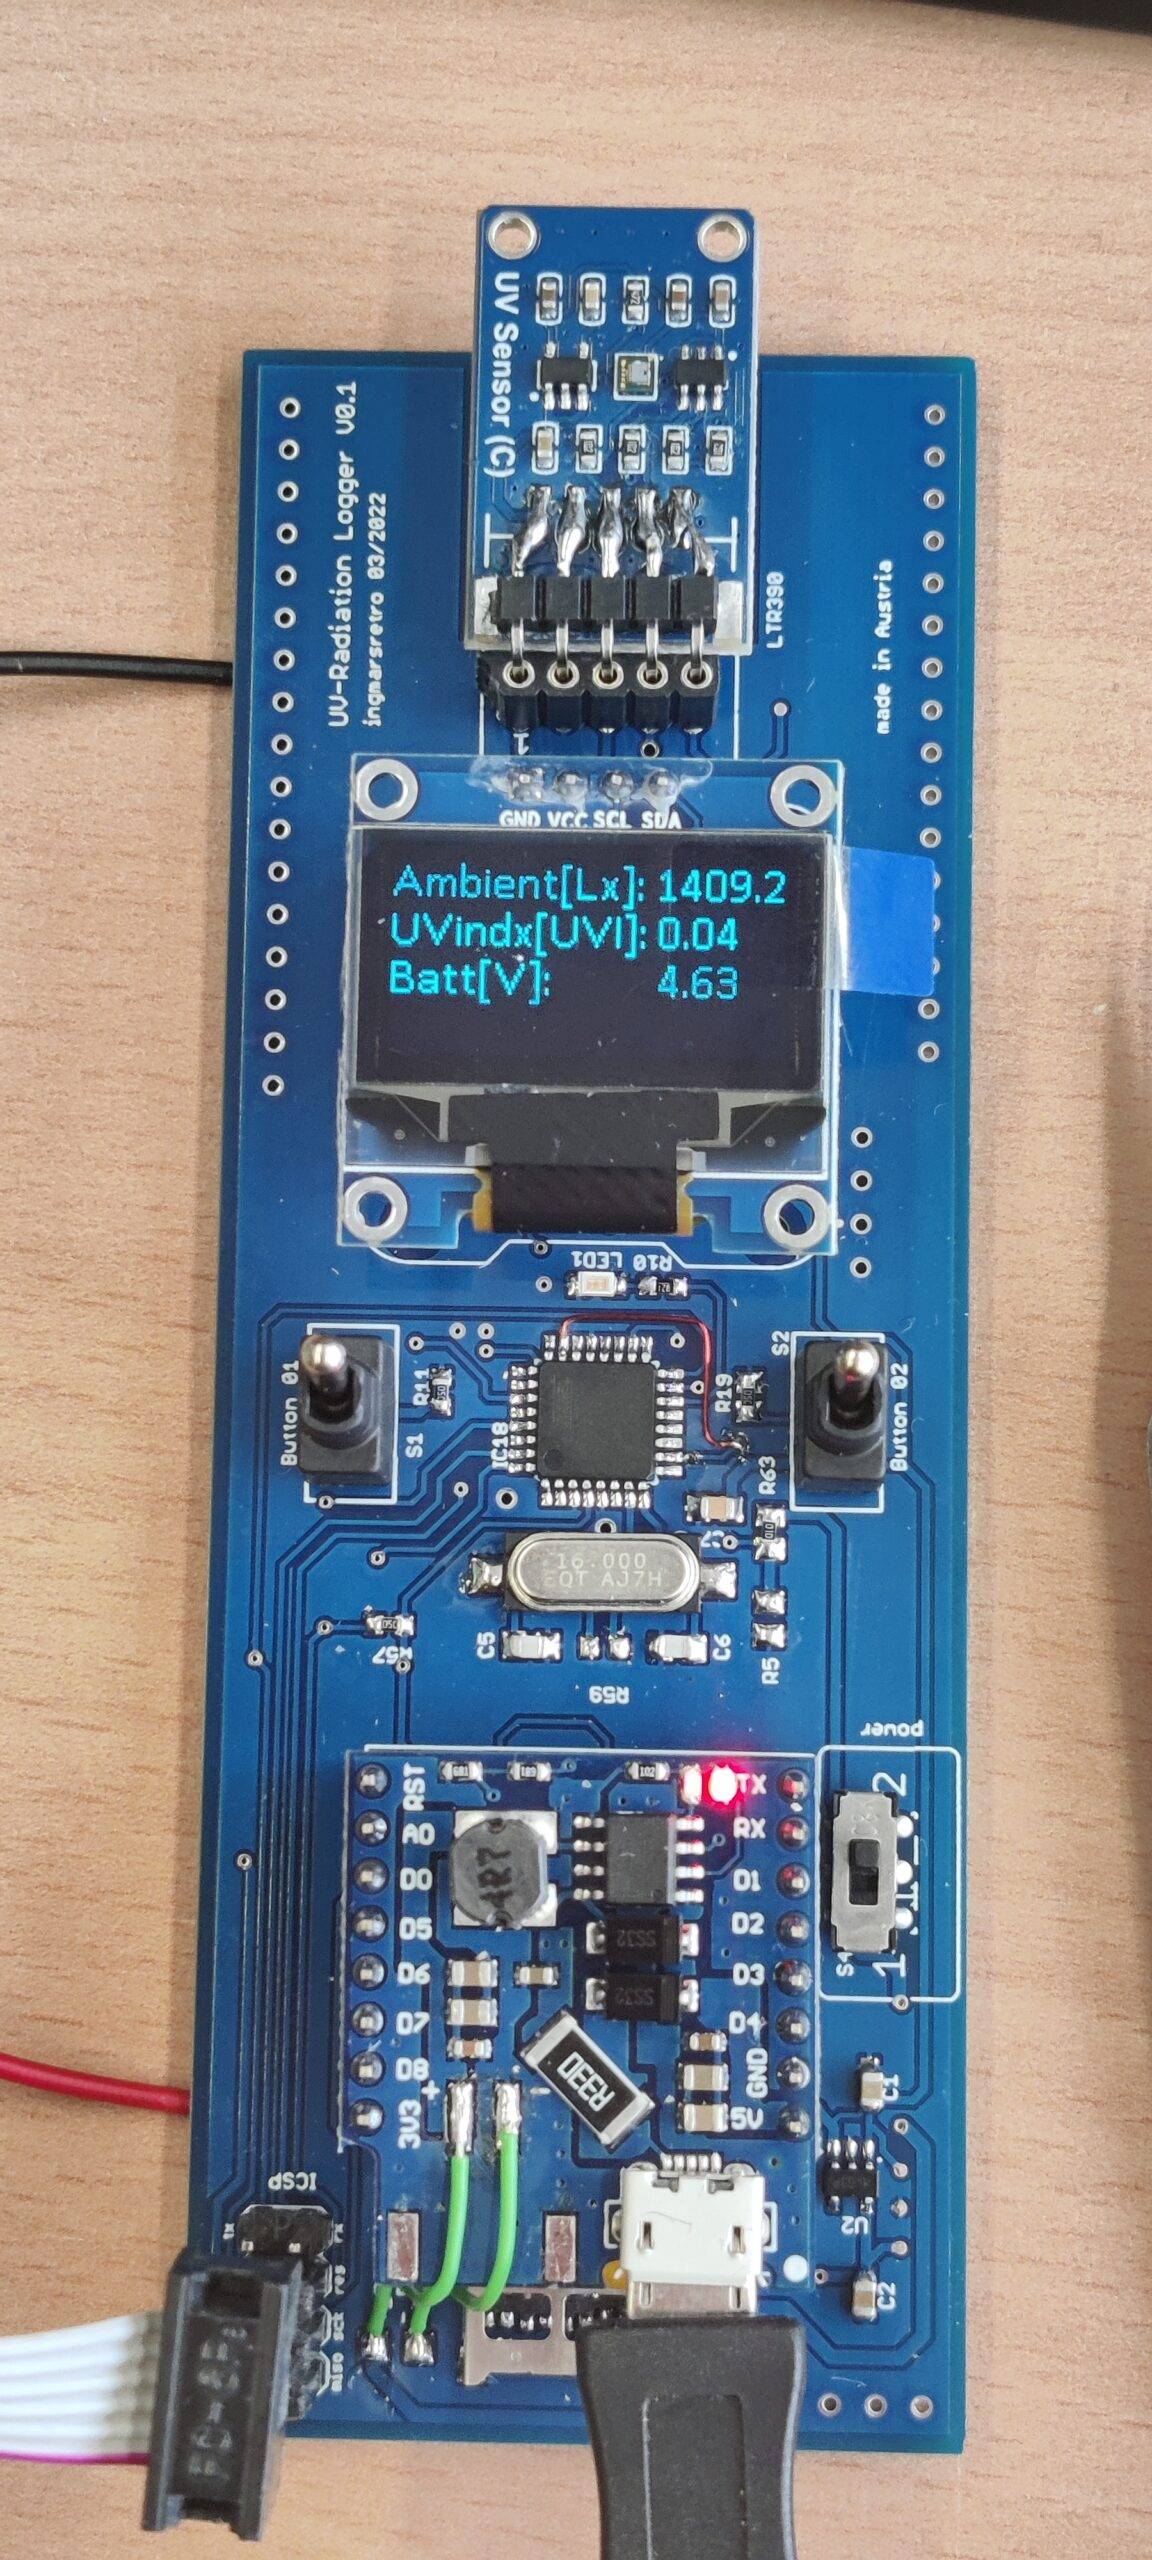
I’m happy to post the entire code here if needed. However, it is not rocket science, but simple and certainly not optimized lines of code writing 🙂 In the current code (firmware) version 1.3d there is a small selection menu that makes it possible to set the log interval of the SD card recording and of course the start or stop recording. It is logged in a text file. The data recorded are UV index, ambient brightness and battery voltage.
I’ve included an excerpt from the datalog below:
 Ambient[lx], UV-indx, Batt[V], Loggingintervall[s]
 691.60,0.01,3.77,20
 691.60,0.03,3.76,20
 1184.00,0.03,3.77,20
 1184.00,0.03,3.75,20
 1191.00,0.03,3.77,20
 1191.00,0.03,3.75,20
 1198.60,0.03,3.76,20
 1198.60,0.03,3.73,20
 1211.60,0.03,3.76,20
 1211.60,0.04,3.75,20
 1223.00,0.04,3.75,20
 1223.00,0.04,3.76,20
 1234.20,0.04,3.76,20
 1234.20,0.04,3.74,20
 1243.60,0.04,3.76,20
 1243.60,0.04,3.76,20
 1252.00,0.04,3.75,20
 1252.00,0.04,3.73,20
 1261.20,0.04,3.74,20
 1261.20,0.04,3.72,20
 1269.60,0.04,3.76,20
 1269.60,0.04,3.76,20
 1278.40,0.04,3.76,20
 1278.40,0.04,3.75,20
 1288.40,0.04,3.76,20
 1288.40,0.04,3.75,20
 1298.20,0.04,3.76,20
 1298.20,0.04,3.74,20
 1305.80,0.04,3.73,20
 1305.80,0.04,3.73,20
 1313.20,0.04,3.73,20
 1313.20,0.04,3.75,20
 1321.60,0.04,3.74,20
 1321.60,0.04,3.75,20
 1331.80,0.04,3.75,20
 1331.80,0.04,3.75,20
 1341.60,0.04,3.74,20
 1341.60,0.04,3.76,20
 1349.40,0.04,3.76,20
 1349.40,0.04,3.76,20
 1358.20,0.04,3.72,20
 1358.20,0.04,3.76,20
 1365.60,0.04,3.74,20
 1365.60,0.04,3.73,20
 1374.20,0.04,3.72,20
 1374.20,0.04,3.75,20
 1380.60,0.04,3.75,20
 1380.60,0.04,3.76,20
 1386.60,0.04,3.75,20
 1386.60,0.04,3.76,20
 1394.80,0.04,3.75,20
 1394.80,0.04,3.75,20
 1401.40,0.04,3.73,20
 1401.40,0.04,3.74,20
 1408.60,0.04,3.75,20
 1408.60,0.04,3.74,20
 1414.20,0.04,3.73,20
This data can now be processed very easily and displayed graphically. As an Office user, you can use Excel, for example, and import the data there and display them as graphs. But it is even easier and also very fast with tools like Matlab. With a script like the one below you can visualize the log file.
 %% Setup the Import Options and import the data
 opts = delimitedTextImportOptions("NumVariables", 4);
 opts.DataLines = [3, inf];
 opts.Delimiter = ",";
 opts.VariableNames = ["Ambientlx", "UVindx", "BattV", "Loggingintervalls"];
 opts.VariableTypes = ["double", "double", "double", "double"];
 opts.ExtraColumnsRule = "ignore";
 opts.EmptyLineRule = "read";
 opts = setvaropts(opts, ["Ambientlx", "UVindx", "BattV"], "TrimNonNumeric", true);
 opts = setvaropts(opts, ["Ambientlx", "UVindx", "BattV", "Loggingintervalls"], "DecimalSeparator", ",");
 opts = setvaropts(opts, ["Ambientlx", "UVindx", "BattV"], "ThousandsSeparator", ".");
 datalog = readtable("F:\ingmarsretro\datalog.txt", opts);
 clear opts
 x=size(datalog); % groesse der tabelle
 measurement=x(1); % anzahl messungen
 uvi=datalog{1:measurement,2};
 ambient=datalog{1:measurement,1};
 messzeit = linspace(0,(measurement*datalog{1,4}),measurement); %zeitvektor von 0 bis zeitintervall aus datalog spalte4 * messungen
 figure(1);
 title('UV - Index');
 subplot(2,1,1);
 plot(messzeit,uvi);
 title('UV - Index');
 xlabel('Zeit [s]');ylabel('UV - Index');
 subplot(2,1,2);
 plot(messzeit,ambient);
 title('Beleuchtungsstärke');
 xlabel('Zeit [s]');ylabel('Beleuchtungsstärke [lux]');
If the script is executed, you get a plot that visualizes the measurement data.

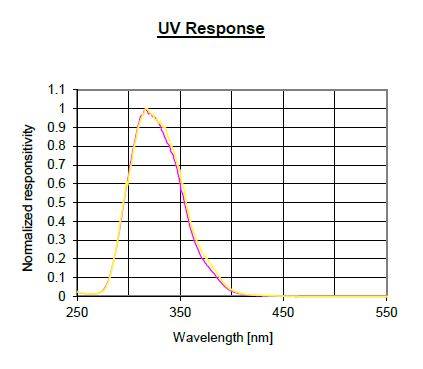
The technical information on the sensor can be found in the manufacturer’s data sheet. Here are a few key points:
 The LTR390 consists of two photodiodes, one for the visible spectrum of light and one that is sensitive in the UV range. The photodiode current is digitized in internal ADCs. An internal logic controls the ADCs and the connection to the outside world is established via an I²C interface. The resolution of ALS and also UVS can be configured in 13, 16, 17, 18, 19 and 20 bits. The sensor chip is housed in a 2x2mm 6pin package. The detector opening has an edge length of 280×280 µm.
Source: LTR-390UV data sheet https://optoelectronics.liteon.com/en-global/Led/LED-Component/Detail/926
Source: LTR-390UV data sheet https://optoelectronics.liteon.com/en-global/Led/LED-Component/Detail/926

