Tag Archives: AVRISPmkII

The Wetterfrosch 2.0 or environmental data logger

Loading

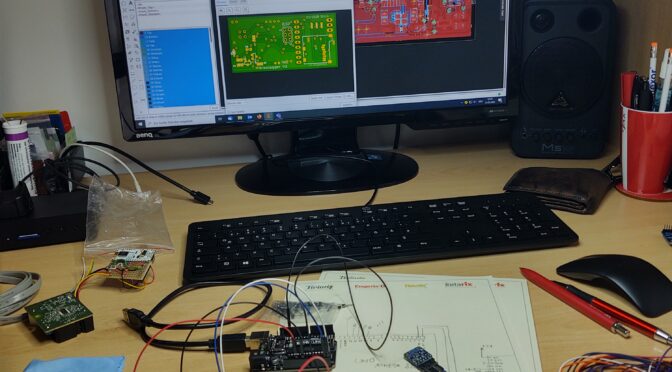
A few years ago I presented a project in which a Raspberry Pi was working as a data logger. A few sensors were connected to this Raspberry, which recorded environmental data such as air temperature, relative humidity, air pressure and the current GPS position. The sensors mostly consisted of ready-made breakout boards that were connected to the RaspberryPi via the various buses (I²C, Serial, SPI …). Python scripts ran on the PI itself, which read out the sensors, summarized the data and stored it on a USB flash memory. I then built this hodgepodge of components into a plastic box with a size of 150x80x50mm.

But it’s also about a lot smaller. As part of a small project, the task was to downsize this sensor / data logger. My approach to realizing this was very simple: “Everything new”. So I changed the concept like this:

  • the RaspberryPi is replaced by a microcontroller
  • a circuit board is created on which all components are housed
  • the recorded data is saved on a microSD card
  • the board is reduced to the most essential components. The sensor electronics and the SD card reader are placed directly on the board
  • a GPS receiver (in the form of a breakout board) should be able to be plugged in as an option
  • the controller is programmed via an ISP interface
  • the power supply is 5V DC

From this I created the following block diagram:

Block diagram

As is so often the case, the central element is the Atmega328 microcontroller. As an external circuit, it only needs a quartz for clock stabilization. (More precisely, it also offers the option of using internal oscillators …) The microcontroller communicates with the sensors HYT939 and BME280 via the I²C bus. The level from 5V on the controller side to 3.3V on the sensor side is adjusted via the sophisticated bidirectional level shifter circuit using a BSS138 Mosfet with an integrated body diode. This circuit is used for both the SCL (Serial Clock) and the SDA (Serial Data) line.

The data is saved on a microSD card. A card slot is installed for this, which communicates with the controller via SPI (Serial Peripheral Interface). An adjustment of the signal amplitudes is also necessary here. This time, however, the TXB0108 chip from Texas Instruments takes care of that. This is an 8-bit bidirectional level shifter.

A button will start and stop data recording and a LED will display various status messages through flashing sequences.

The optional plug-in GPS module works with a 5V power supply and the levels of the serial data communication (RS232) are also 5V compatible.

Last but not least, the power supply must of course also be planned. Only an external, stabilized 5VDC source should be connected here to supply the logger. The 3.3VDC required for the sensors and SD card are generated on the board by means of an LDO (Low Drop Out) controller.

Once all components and their interaction have been defined, the circuit diagram is drawn from them. For my handicraft projects I mainly use the schematic and layout editor “eagle”. The circuit shown below results from the block diagram.

From the circuit diagram I created a layout with two layers, the floor plan of which has the dimensions 55x25mm. Except for the connectors, only SMD components are on the board.

In the layout tool there is the function to view an optical preview of the finished board. In this way you can check in advance whether the board corresponds to the requirements and, if necessary, optimize the position of the components. Once this is done, a package with production files (Gerber files) is generated from the design and this is then sent to the circuit board manufacturer you trust. Since it is also located very, very far away, production also takes a few days. But in the end the circuit boards arrive and are also impressive. 🙂

The two pictures above show the board from the TOP and the BOTTOM side. The next step is to order the components according to the plan and then assemble them.

I do the assembly by hand with a soldering iron suitable for the SMD components with a correspondingly small tip. For the very small parts, such as the BME280 sensor, a microscope or microscope camera is also used.

The two pictures above show what the board looks like after it has been assembled. The following photo shows the size difference of the finished logger with the attached GPS module compared to the old “weather frog”After completing the hardware, it is now time to start with the software. I tinkered it in a practical way with the Arduino IDE tool and flashed it to the controller via AVRISP mk2 via ISP. In order to get the AVRISP to work on a Windows 10 computer, a suitable driver must be installed. (libusb-win32-1.2.6.0 helps here)

program code created with the ArduinoIDE
controller flashed with AVRISPmkII

Data recording is started on the SD card after applying the supply voltage and pressing the button. The measured values ​​are written every second. If, as in this example, the GPS sensor is plugged in, the GPS data is also recorded. The software also records if the GPS sensor does not have a “fix” yet. (Since there was no GPS fix in the example log below, no valid GPS data is included.)

Example of the data log:

Luftdruck962.41
Luftfeuchte37.05
Temperatur26.96
-----------------------------
$PGACK,103*40
$PGACK,105*46
$PMTK011,MTKGPS*08
$PMTK010,001*$GPGGA,235947.799,,,,,0,00,,,M,,M,,*71
$GPGLL,,,,,235947.799,V,N*73
$GPGSA,A,1,,,,,,,,,,,,,,,*1E
$GPGSV,1,1,00*79
$GPRMC,235947.799,V,,,,,0.00,0.00,050180,,,N*48
$GPVTG,0.00,T,,M,0.00,N,0.00,K,N*32
$GPGGA,235948.799,,,,,0,00,,,M,,M

-----------------------------
Luftdruck962.39
Luftfeuchte36.72
Temperatur26.95
-----------------------------
Luftdruck962.43
Luftfeuchte36.66
Temperatur26.97
-----------------------------